12 March 2023
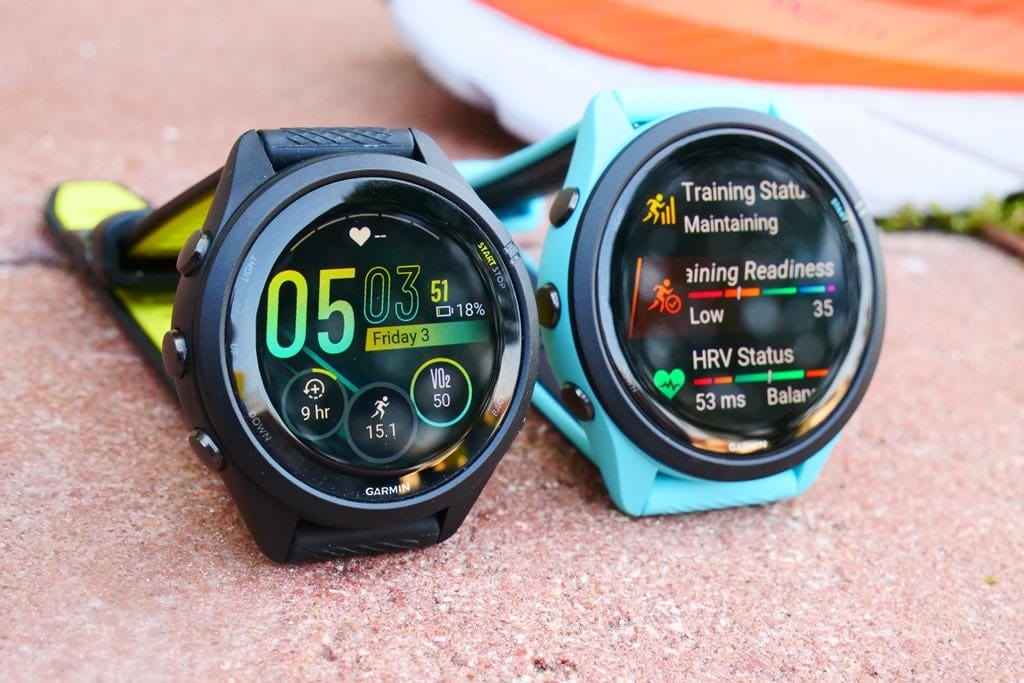
The Forerunner 265 series watches have become Garmin’s lowest-priced AMOLED display endurance sports-focused watch, coming in at roughly half the price of the Garmin Epix series launched a year ago – but here with full multiband GNSS support on all Forerunner 265 units, while also adding in Training Readiness – a major Garmin endurance sports focused feature. Note that Garmin also announced the new Forerunner 965 unit concurrently, also sporting an AMOLED display.
Beyond the screen and Training Readiness, it also gains some new software features, such as the wrist-based Running Dynamics, joining the recently added wrist-based Running Power. Further, all units now have offline music storage built-in – including Spotify support. Like before, there are two sizes of units, and a few color options for each size.
As usual, I’ve been putting the Forerunner 265 through its paces – with swims, runs, rides – all indoors and outdoors, and then daily 24×7 usage as well. Concurrently, my wife has been putting the Forerunner 265S through the wringer while comparing it to her Fenix 7S. All of this in the pursuit of seeing how well these watches actually work for both daily endurance sports training and day-to-day usage.
Garmin sent over a couple of media loaners to test out. As usual, this review is not sponsored (nor does any company get to preview anything I review), and I don’t take any advertiser money from any companies I review. Once this unit goes back, I’ll go out and buy my own for any future testing needs. If you found this review useful, you can use the links at the bottom, or consider becoming a DCR Supporter, which makes the site ad-free, while also getting access to a mostly weekly video series behind the scenes of the DCR Cave. And, of course, it makes you awesome.
What’s New:
At first glance, the Forerunner 265 series might seem like just an AMOLED version of the Forerunner 255. In fact, a number of the new software features on the Forerunner 265 are coming to the Forerunner 255 via software update. But there’s one critical component not coming to Forerunner 255 that’s been added to the Forerunner 265: Training Readiness.
This feature launched last summer on the Forerunner 955, and given the Forerunner 265 price point is nearly the same ($449 for the Forerunner 265 vs $499 for the Forerunner 955), it made sense to include it. But, it won’t be showing up on the less-expensive $349 Forerunner 255.
Of course, there are still a number of hardware differences between the Forerunner 255 and Forerunner 265/265S, so let’s dive into all of them:
– Changed to always-on AMOLED display (far more vibrant colors/brightness/etc)
– Added touchscreen
– Still two sizes, a 42mm and 46mm size (previously the FR255 was a 41/46mm sized case)
– Display sizes are now 1.1” for the 42mm, and 1.3” for the 46mm (same as before)
– Watch thickness decreases by 0.5mm (from 12.9mm to 12.4mm)
– Display resolution for 41/42mm increases from 218x218px to 360x360px
– Display resolution for 46mm increases from 260x260px to 416x416px
– Weight decreases from 49g to 47g for the 46mm, and stays at 39g for the 42mm
– Lens material is Gorilla Glass 3 (same as previous)
– Switched to USB-C Garmin charging cable (same watch port design as previous)
– Added offline music storage as a baseline (no two separate versions)
– Added Training Readiness feature (huge feature set!)
– Added built-in Running Dynamics (e.g., Vertical Ratio, Ground Contact Time, etc…) without any sensor
– Revamped user interface to sorta-match the Garmin Epix AMOLED units
– Fully supports Physio TrueUp 2.0 (Unified Training Status, albeit now so does Forerunner 255)
– Price is $449 for Forerunner 265/265S, versus $399 for FR255 Music, and $349 for FR255 base
– Battery life changes per below
– No ECG hardware internally
Now, in addition to this, Garmin also announced the new Forerunner 965, which is also am AMOLED display version of the existing Forerunner 955. In the case of that unit, there are some added hardware benefits (a larger 1.4” screen, titanium bezel), as well as a few new software features (Training Load Ratio and Chronic Load). But by and large it’s the same software as the Forerunner 955. Both the Forerunner 255/265 and the Forerunner 955/965 are full multisport watches, complete with power meter sensor compatibility and more.
Which then invariably brings up the question of how does the Forerunner 265 differ from the Forerunner 965? Here are the high-level differences (keep in mind that there are a ton of minor differences, for example courses/routing itself has a massive number of sub-features):
– Forerunner 955/965 has full maps, the Forerunner 255/265 does not (both can follow courses however)
– Forerunner 965 has a 1.4” AMOLED display, whereas Forerunner 265 has a 1.3” AMOLED display with 1.1” for 265S
– Forerunner 955/965 supports recording Garmin Cycling Dynamics power meter metrics, the Forerunner 255/265 does not (oddly Instinct 2 does record these…)
– Forerunner 955/965 has ‘Stamina’ data field during workouts for longer-duration pacing, FR255/265 does not
– Forerunner 955/965 have ClimbPro features, the Forerunner 255/265 do not
– Forerunner 955/965 have a slate of map-dependent navigation/routing features, the Forerunner 255/265 do not
– Forerunner 955/965 have navigation Next Fork feature, the Forerunner 255/265 do not
– Forerunner 965 has Training Load Ratio and Chronic Load, the Forerunner 255/265 does not
– Forerunner 955/965 has FTP auto-detection, the FR255/265 does not (both have Lactate Threshold & Max HR detection though)
– Both the Forerunner 965 and Forerunner 265 have built-in Running Dynamics (the FR955/FR255 will get via firmware update)
– Both have multiband GPS, including new ‘AutoSelect’ SatIQ mode
– Both have WiFi (assuming you get FR255 Music edition)
– Both have downloadable music (including Spotify/Deezer, and Amazon Music, plus MP3s).
– Both have HRV status, SpO2 sensor, and all the same other daily activity tracking metrics
– Both have morning report, race widget, and daily suggested workouts
– Both have Garmin Pay, incident detection, and LiveTrack (with phone nearby)
– Both use the same standard Garmin charging port cable
– GPS mode battery life of FR965 is stated as up to 31 hours, FR265 GPS mode life is stated as up to 20 hours, and FR265S at 24 hours
– Smartwatch battery life of FR965 is stated as 23 days, FR265 smartwatch mode is 13 days, and FR265S at 15 days
– Forerunner 965 is priced at $599, Forerunner 265 is priced at $449
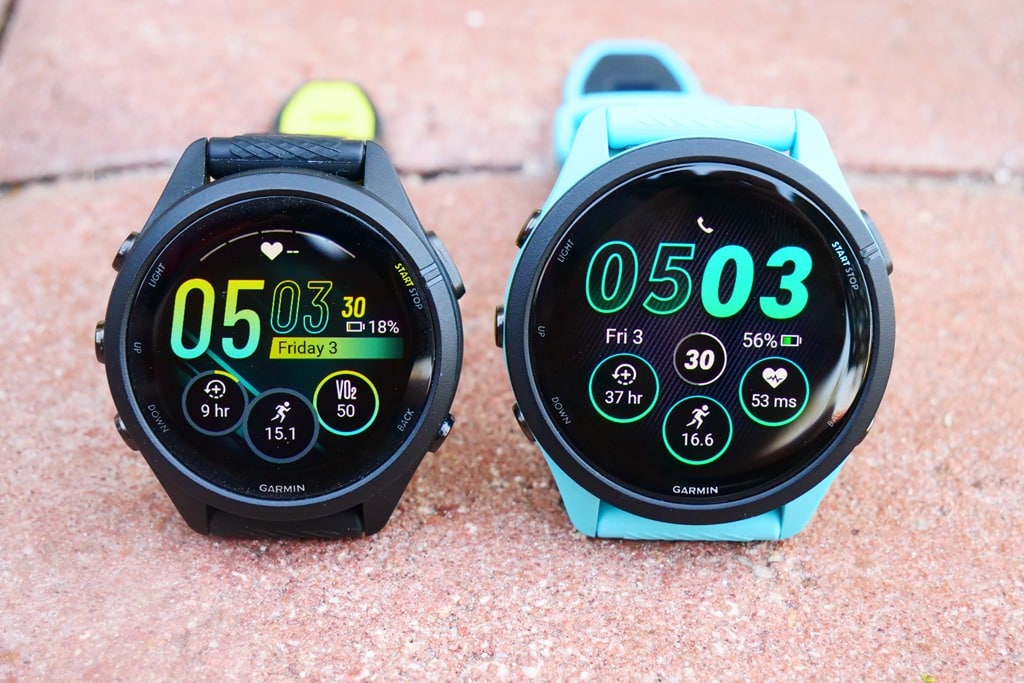
Now, for lack of anywhere else to stick it at the moment (till I finish re-doing unboxing photos), here are some pictures of my wife and me with a slate of watches showing wrist sizing. My wrist size is 17cm (or about 6.5 inches), and I’m 6’2”/188cm tall. My wife has a wrist size of 14cm (or 5.5 inches) and is 5’2”/158cm tall. The watches here are here Fenix 7S Solar Sapphire, my Epix (Gen2), and the Forerunner 965, Forerunner 265, and Forerunner 265S.
Phew, got all that? Let’s start using the watch.
The Basics:
This first section will focus on all of the day-to-day features of the watch, things like activity tracking, sleep tracking, morning report, and related basic usage concepts (touchscreen, display, battery life). I’ll also cover smartphone integration bits, including notifications. The next section covers the sports pieces in terms of workouts and sport profiles, after which we’ll go deeper into the sports side with the Training Readiness component in Training Load & Recovery Metrics. Finally, I’ll wrap-up in the heart rate and GPS accuracy sections.
Additionally, you’ll soon find a full Forerunner 265 Beginner’s Guide video published, which walks through all of these features step by step. It’s a long-form video that typically ends up being about 30-45 minutes, but includes lots of pro tips.
Note that aside from size, battery life, and screen size, the Forerunner 265/265S are identical. Thus when I say ‘Forerunner 265’, I’m referring to both unless otherwise stated. I’ve been testing the Forerunner 265 (large), and my wife has been testing the Forerunner 265S (small).
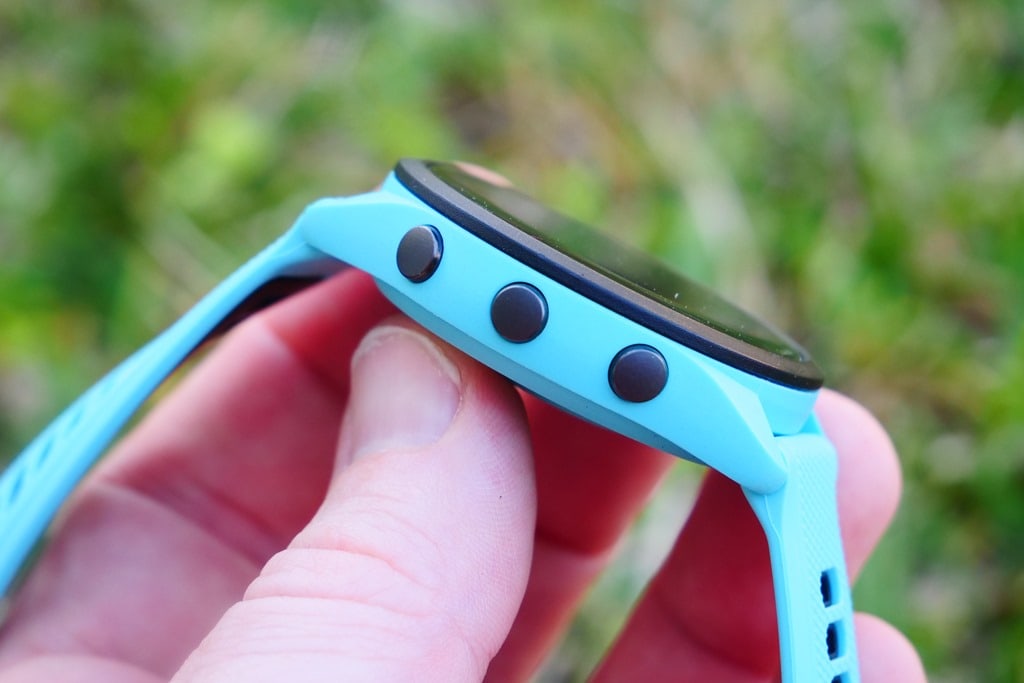
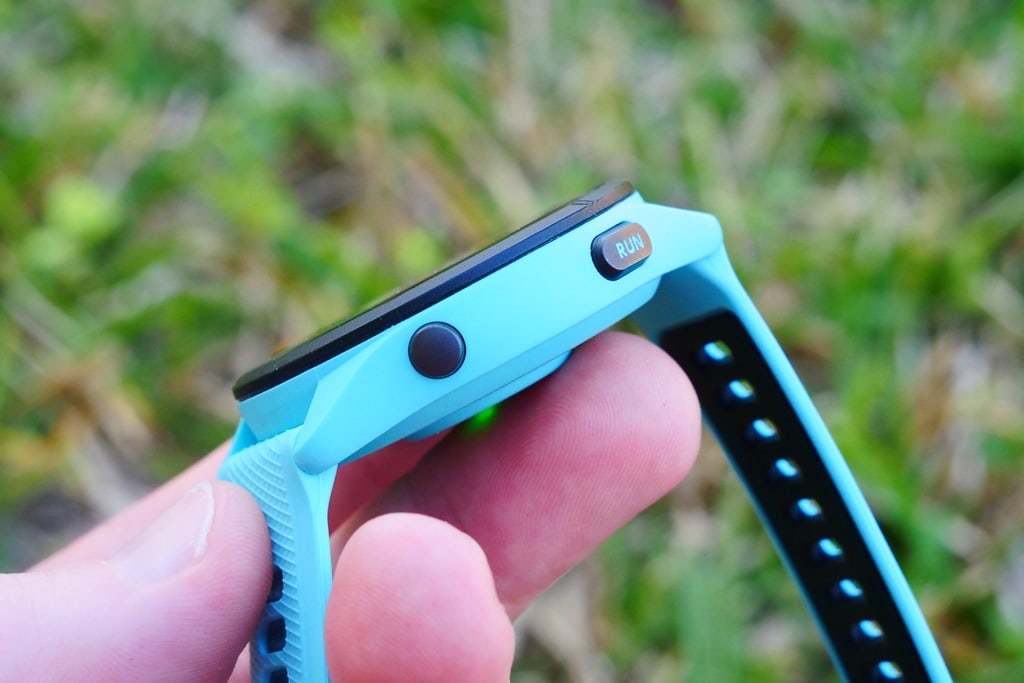
With that, let’s start with the hardware basics. The Forerunner 265S/265 both have 5 buttons, like most Garmin sport watches. The three buttons on the left side are mostly used for navigating menus. There are two more buttons on the right side, which are mainly used for confirmation and back/escape (plus starting/stopping). You can also long-hold any of these buttons for further functions, including the ability to assign quick-access buttons.
In addition to the buttons, a notable new feature on the Forerunner 265 is the touchscreen option – giving you that option. The FR265 keeps the Garmin sports watch mantra of “Use it if you want, don’t if you don’t”. Meaning, every single function on the Forerunner 265 can be completed via buttons instead of the touchscreen. You can literally disable the touchscreen if you want – with no impact to features. Inversely, if you’re all about touch, you can do almost everything via touch (except starting/stopping a workout and hitting the lap button).
While some watches have trouble with touch in wet conditions, I don’t generally find that to be the case with Garmin’s recent implementations (including the Forerunner 265). I’ve been in hot and sweaty Florida this past week, drenched with sweat, and having no problems. About the only place you’ll find legit issues is trying to use the touchscreen under the direct water pressure of a shower head.
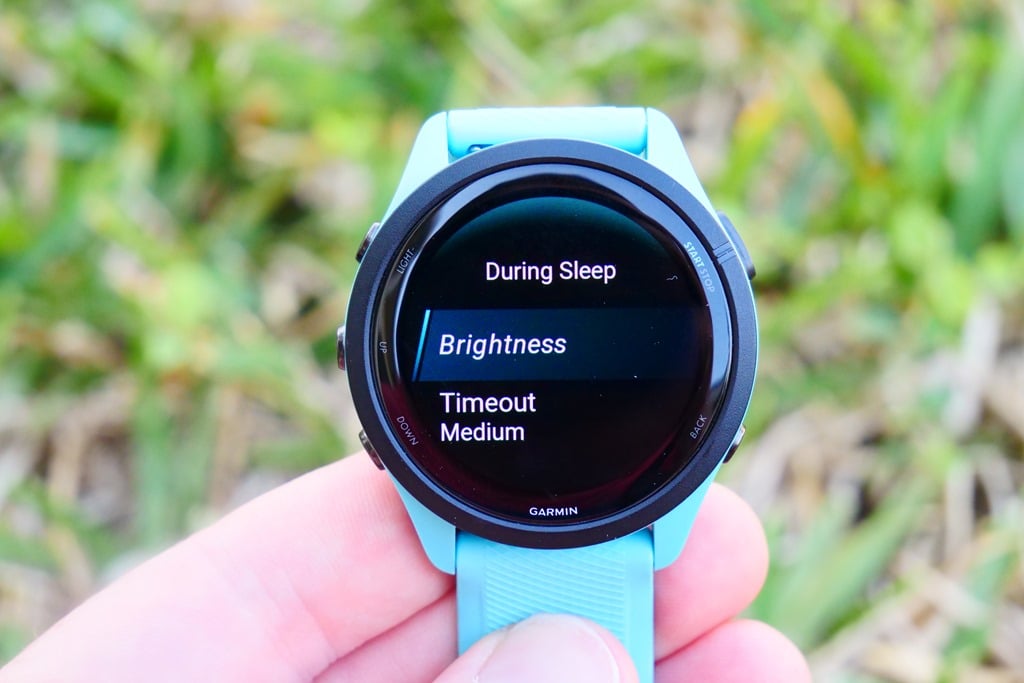
By default, virtually all sport profiles have touch disabled (during a workout). This means you can either enable it across the board during workouts, or you can individually enable it on a specific sport profile. There’s a minor nuance in differences in that on the Fenix 7/Epix series you can also disable it within just sleep too, but that doesn’t appear to be an option on either the Forerunner 265 or higher-end Forerunner 965. To be clear, there’s still nightly do-not-disturb mode and such, which dramatically reduces the chance of the display turning on brightly, unless you physically press buttons to enable it. Sleep mode will automatically enable based on what you’ve defined, but you can also manually enable it at any time by just long-holding the upper left controls buttons. In fact, in sleep mode there are actually four brightness levels, as compared to three brightness levels in daytime mode.
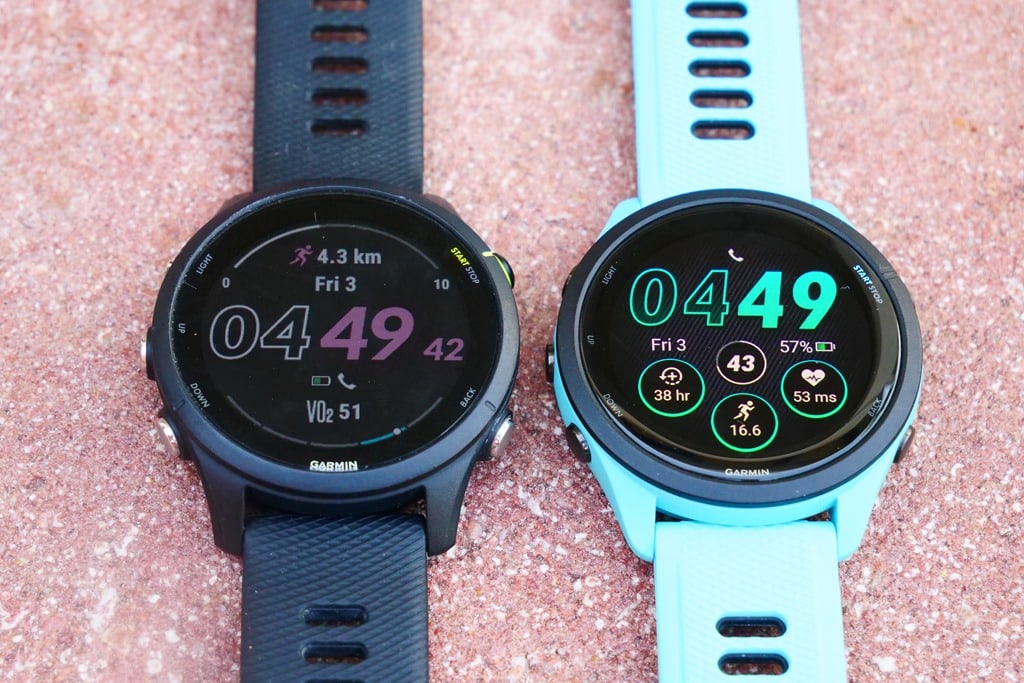
Now, the next bit is the AMOLED display. It’s a massive increase in brightness and display quality. Check out this side-by-side picture with the Forerunner 255 (MIPS-based display) to see the difference:
As noted above, for better or worse, my testing this last week has been in a bright/sunny/hot locale – and I can say there are absolutely zero issues seeing the display using the default settings in bright sun conditions (once you turn/raise your wrist). Just as there were no issues with Epix either for the past year and that AMOLED display, in either bright or dark conditions. The single exception to this is if your wrist is off-axis (such as lower on the handlebars), it can be trickier to see, though frankly, that’s also true of MIPS watches. And indoors, especially in any sort of dim conditions, it’s far easier to read/see an AMOLED display.
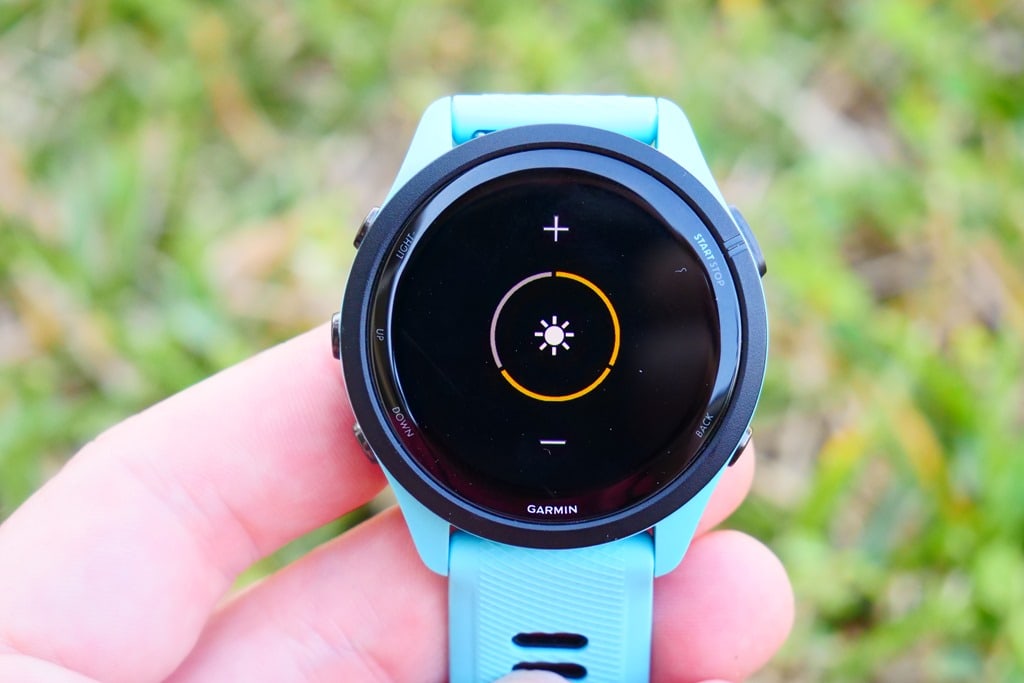
While some people have concerns about brightness on AMOLED displays, that’s quite controllable on Garmin watches with multiple brightness settings for different times of day (sleep/workout/rest of day), and I’ve never found it being over-bright as an issue. In the same way virtually nobody says over-brightness is an issue on the Apple Watch.
Long-story-short, AMOLED displays have changed a ton in the last few years since they started appearing, so I wouldn’t judge a book by a cover from 3-5 years ago.
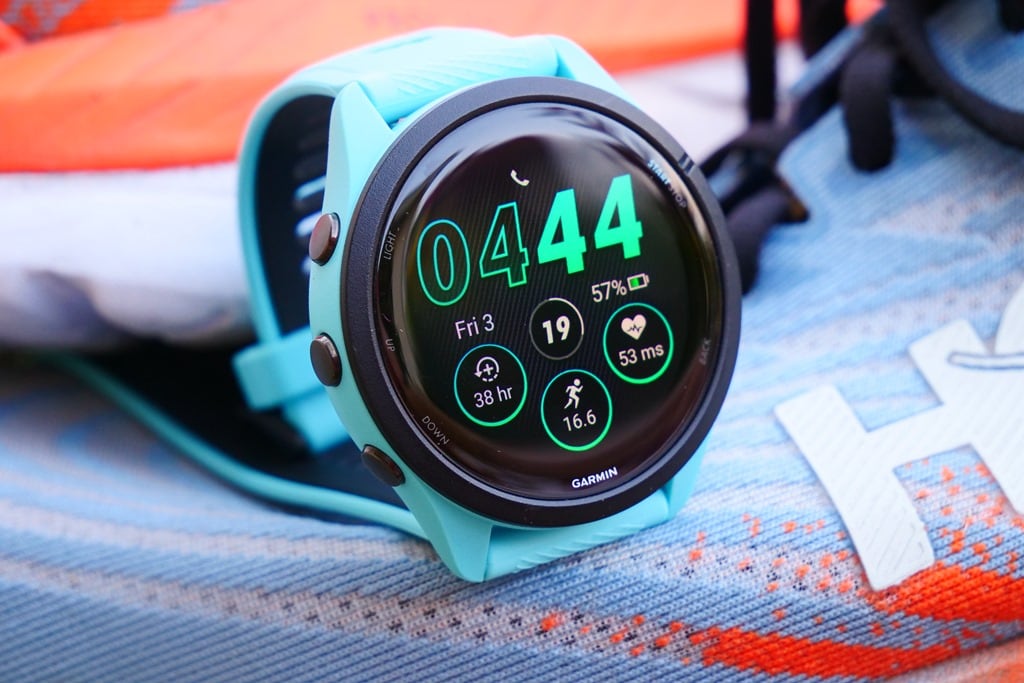
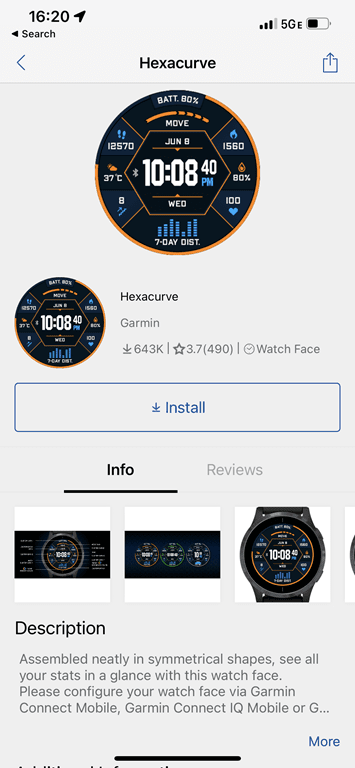
In any case, next up, we’ve got the watch face. As with all Garmin watches, this is fully customizable – in two rough categories. First is a bunch of stock watch faces on the unit that you can choose from, and then individually customize each component (e.g., data fields/complications, coloring, styling, etc…). And then the second way is via Garmin’s Connect IQ app store, which includes boatloads of watch faces. You can also create your own watch face with pictures/photos if you want to.
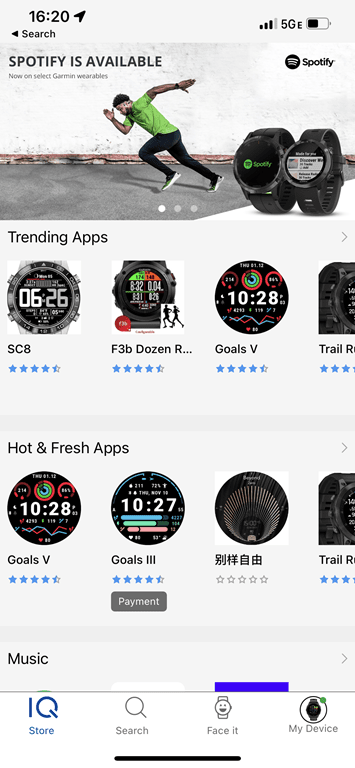
Here’s the Garmin Connect IQ app store, which has a variety of watch faces you can choose from. Typically speaking, on launch day, the number of watch faces that are marked as compatible with the new watch is low, and then over the coming days and weeks it balloons, and developers mark their watch face as compatible/compliant. You can also create your own watch faces using photos from your phone album.
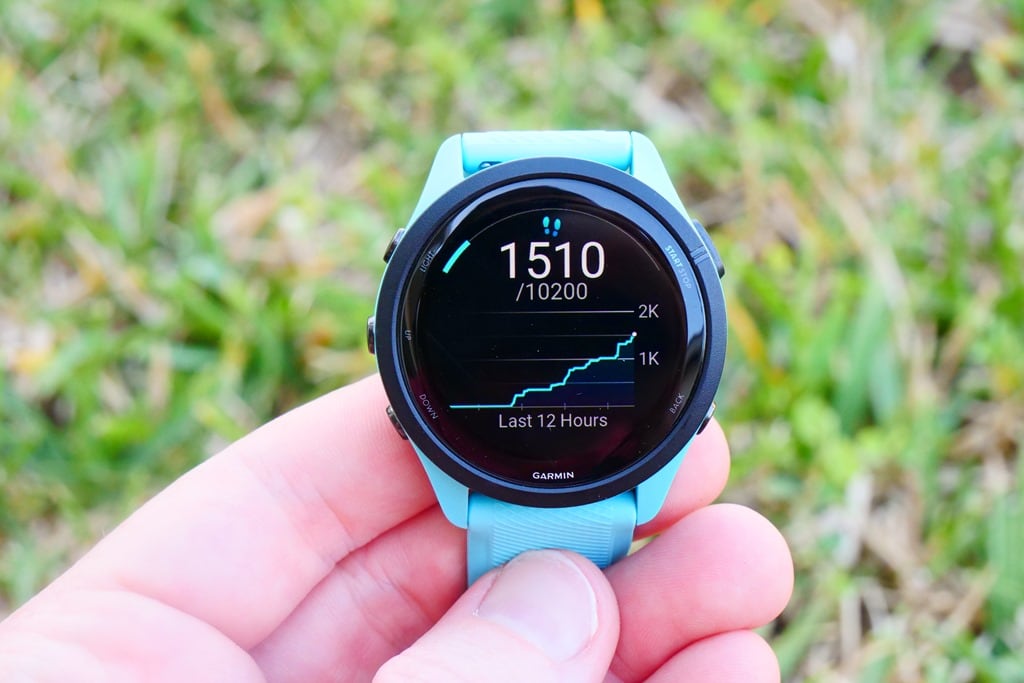
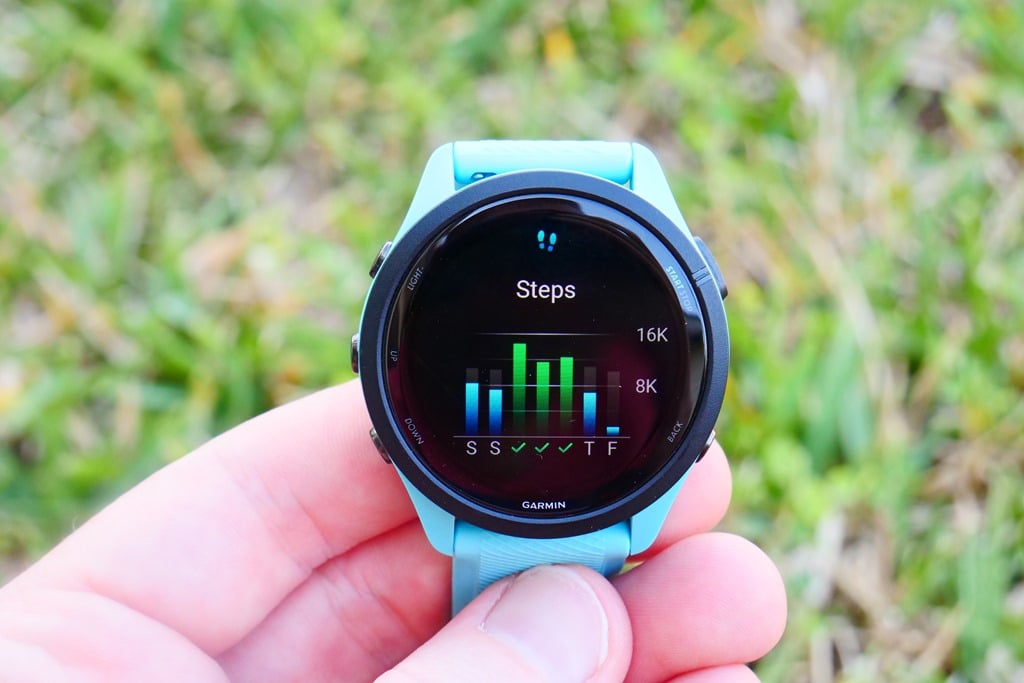
From there, we’ll swipe down to the widget glances area. Widget glances are essentially small tidbits of information for any number of different categories or apps. You can customize which widgets are shown, the order they’re shown, and even download 3rd party widgets. You can also create folders for them too, of your own naming accord. The idea is glanceable bits of information that you can then tap into (or button into) to see more data about that particular item.
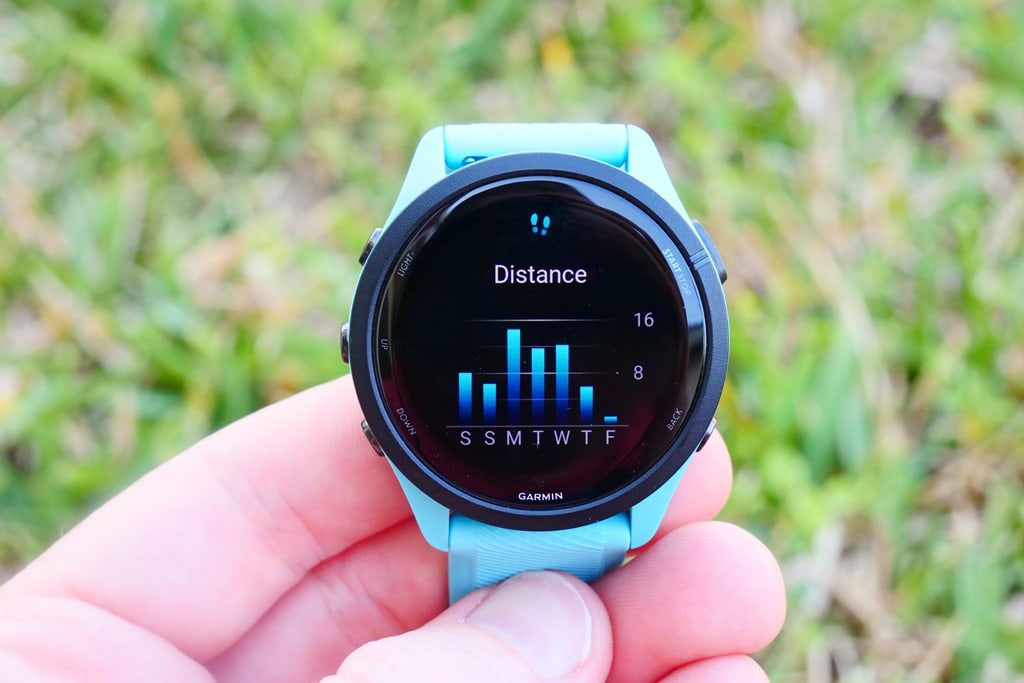
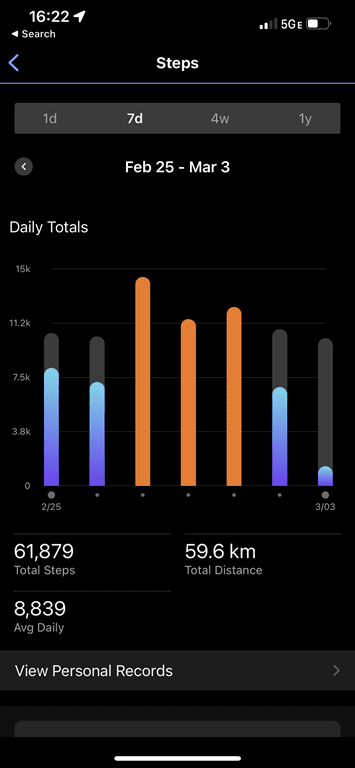
Take steps for example, you can tap on that widget glance to get more detailed information, including your steps over the course of the day, steps by distance per day, and your total distance for the last 7 days displayed daily:
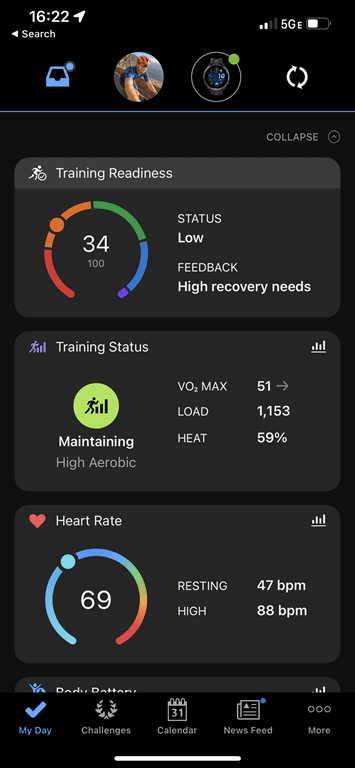
All of this data, be it steps or otherwise, is then concurrently synced to Garmin Connect (via Bluetooth to your phone, USB to your computer, or WiFi). This is where you can dive into the data more deeply, depending on what you’re looking for. Some will say that the Garmin Connect app can be a bit overwhelming with all the data. And there’s undoubtedly a nugget of truth to that. But you can also ignore the deeper caverns of data if you want to, and just focus on the main daily dashboards. In other words, it’s what you make of it. And ultimately, there’s no other company out there that provides anywhere near as much sports/fitness data as Garmin does.
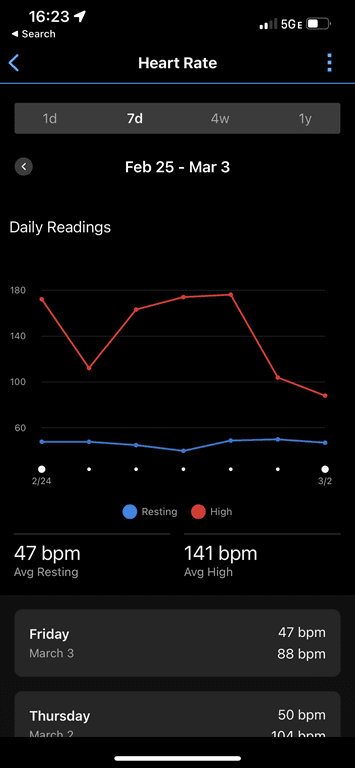
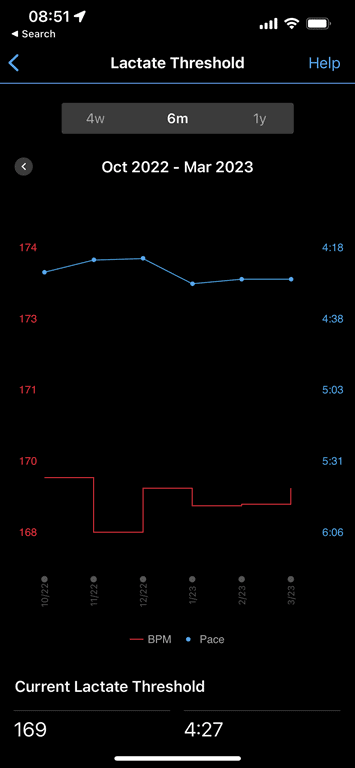
For literally every metric that you can imagine, Garmin lets you dive into the details of it. From heart rate tracking to breathing rate, to lactate threshold automatic detection. Notably though, the Forerunner 265 series does not have cycling power FTP detection. A minor item, but worth mentioning.
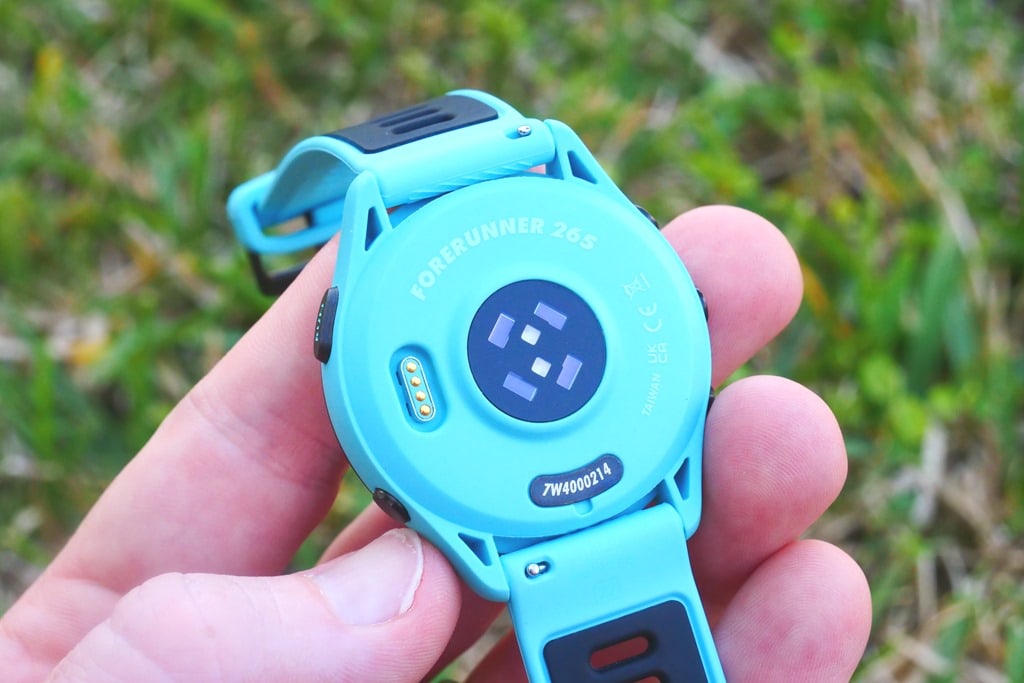
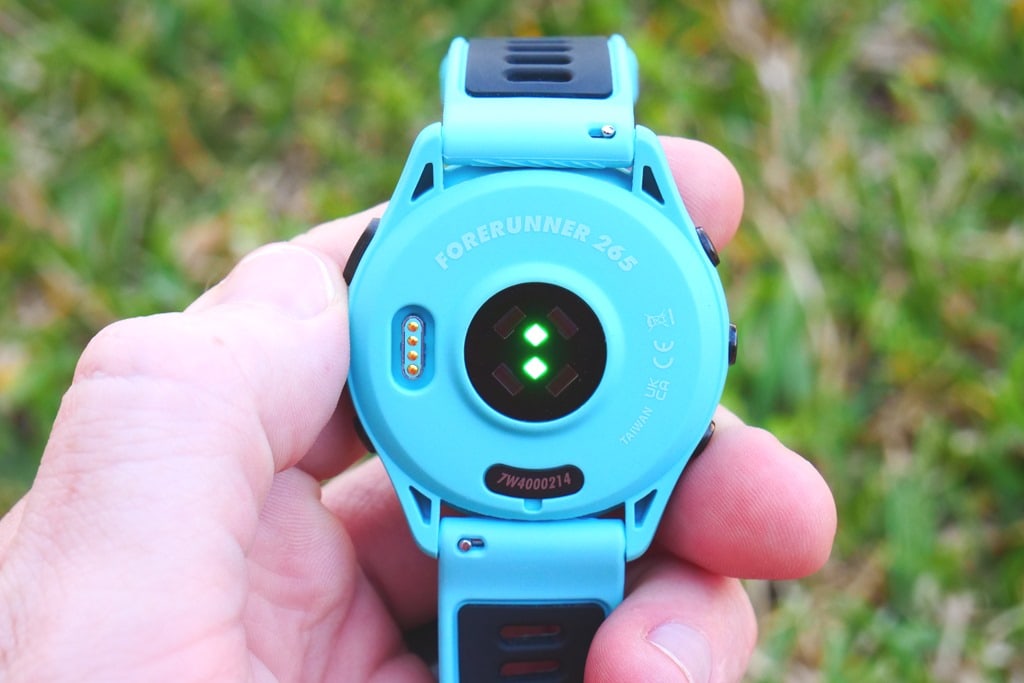
Many of these metrics are derived from data captured by the optical heart rate sensor located on the bottom of the Forerunner 265. This optical HR sensor is powered on 24×7, constantly logging data well beyond just your heart rate. This includes things like calculating breathing rate, HRV, or even blood oxygenation levels (if enabled). The Forerunner 265 uses Garmin’s Elevate V4 sensor (same as on the Fenix 7/Epix/FR955/FR965/FR255/Venu 2 series). The green light is for regular heart rate recordings, while the red light is for blood oxygenation levels (Garmin calls this Pulse Ox):
Unfortunately, despite Garmin introducing ECG on the Venu 2 Plus series a few weeks ago, there is no ECG hardware in the Forerunner 265. This is both confirmed by Garmin, as well as being simply obvious by looking at the bottom of the unit. It lacks the isolating ring around the optical HR sensor, which is required for an ECG.
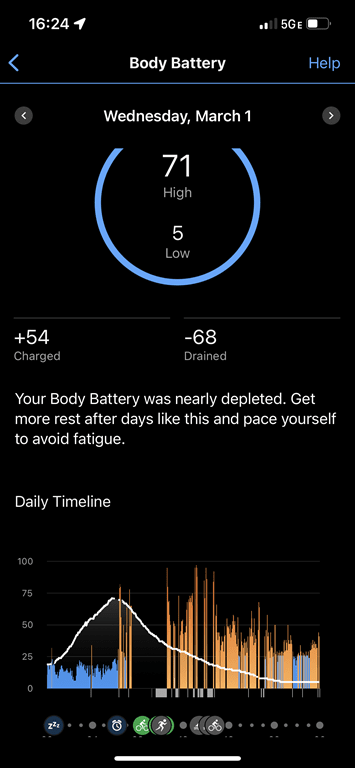
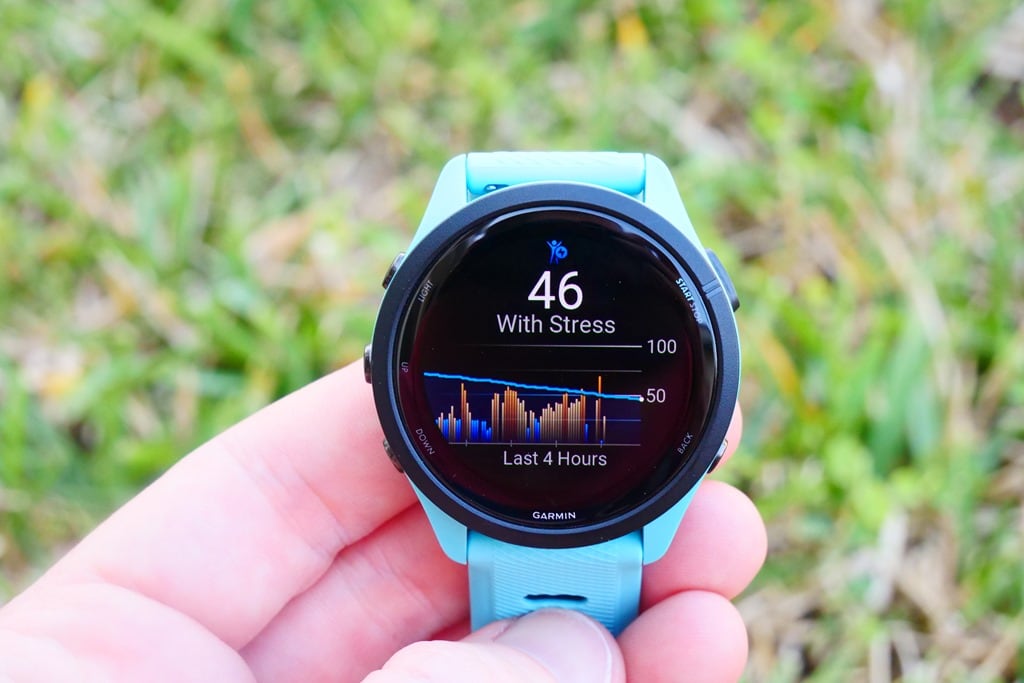
Beyond obvious metrics like heart rate or breathing rate, there’s a slew of algorithmic metrics. These are things that are unique to Garmin (or, at least Firstbeat, the company which Garmin acquired that develops algorithms but still licenses them to other companies). For example, one is Body Battery. Body Battery is basically your energy level. You recharge it every night, and then decrease it during the day, or during periods of relaxation (like sitting on the couch watching TV).
However, with the Forerunner 265 they’ve added Training Readiness, which is aimed at figuring out if you should train (or to what intensity). That’s a big bump up compared to the Forerunner 255, which lacked Training Readiness (it was introduced last year with the Forerunner 955 instead).
Here’s a better way to think of it: Use Body Battery on vacation to see the impacts of your day when you don’t care about training. Whereas, use Training Readiness when you are trying to get workouts in. Training Readiness is much broader in the inputs it accounts for (sleep/workouts/stress), whereas Body Battery really only cares about that single daytime slice. Again, tons more later on this in the ‘Training Metrics’ section.
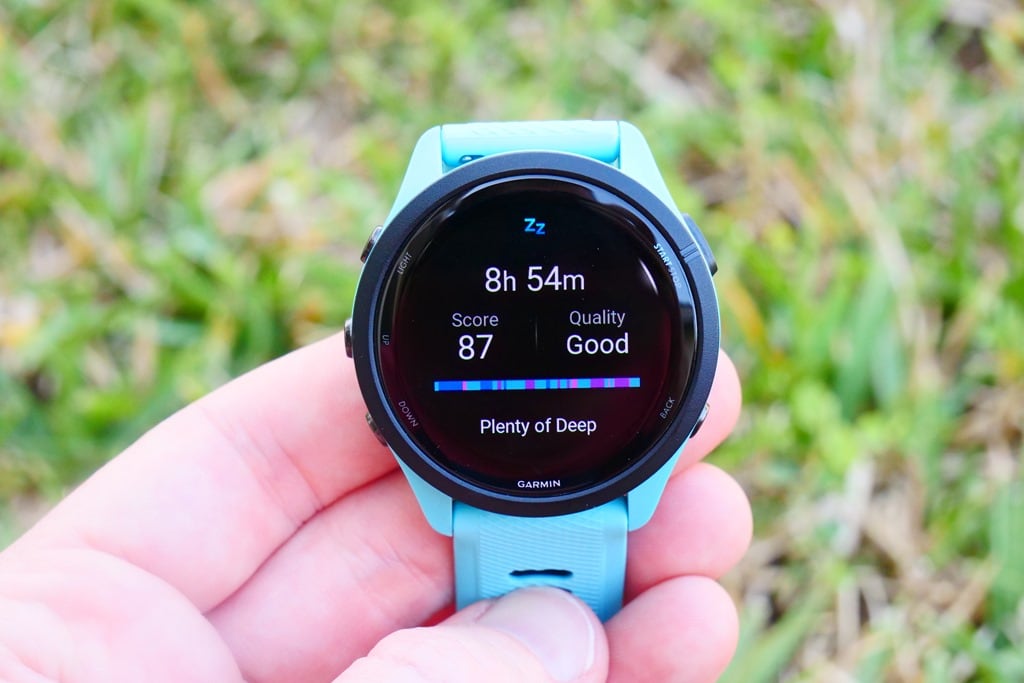
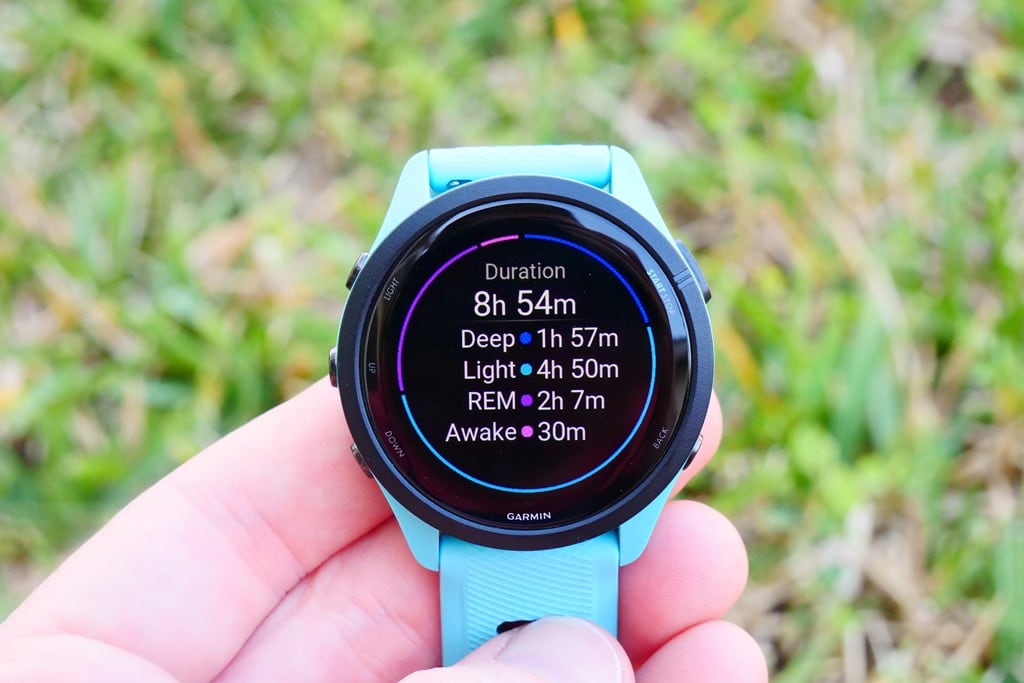
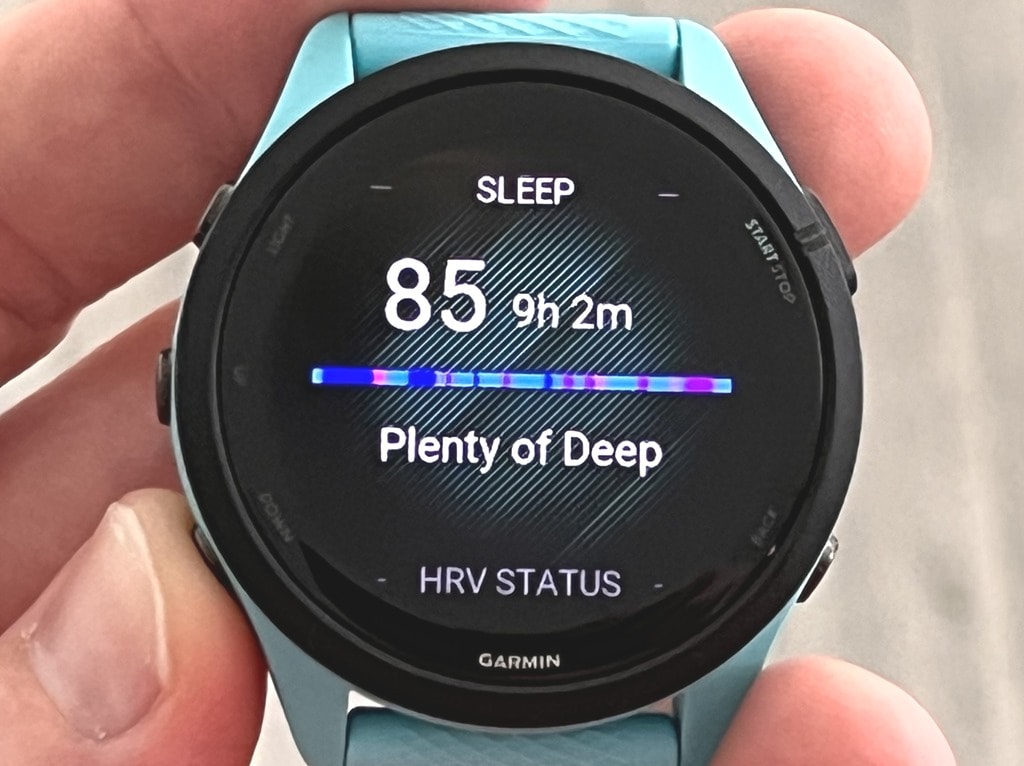
Speaking of sleep, the Forerunner 265 will automatically track your sleep metrics each night. This is roughly grouped into three camps. First is how much time you sleep, the second is your sleep phases (e.g., REM/Deep/Light/Awake), and the third is your Sleep Score. That Sleep score attempts to take those first two camps and give you a graded score for your night (1-100).
In my testing, the sleep times are usually quite accurate (within a few minutes of when I fell asleep/woke up). However, the sleep phases and sleep scores are kinda all over the map. For example, when wearing the Forerunner 265 on one wrist, and the Forerunner 965 on the other wrist, I’ve gotten vastly different sleep scores and sleep phases. That’s because the sleep phases are different, which throws off the sleep scores. And while this might sound like a Garmin-only problem, the reality is most wearables suck at sleep phases. Complicating matters is that there isn’t even a reliable way to validate this data. If I look at the viable home options to compare sleep stages/phases in terms of accuracy, those devices aren’t that accurate by themselves (only about 80% accurate). We’d never accept comparing other features like optical HR accuracy to an “80% accurate chest strap”, so I won’t accept doing so here.
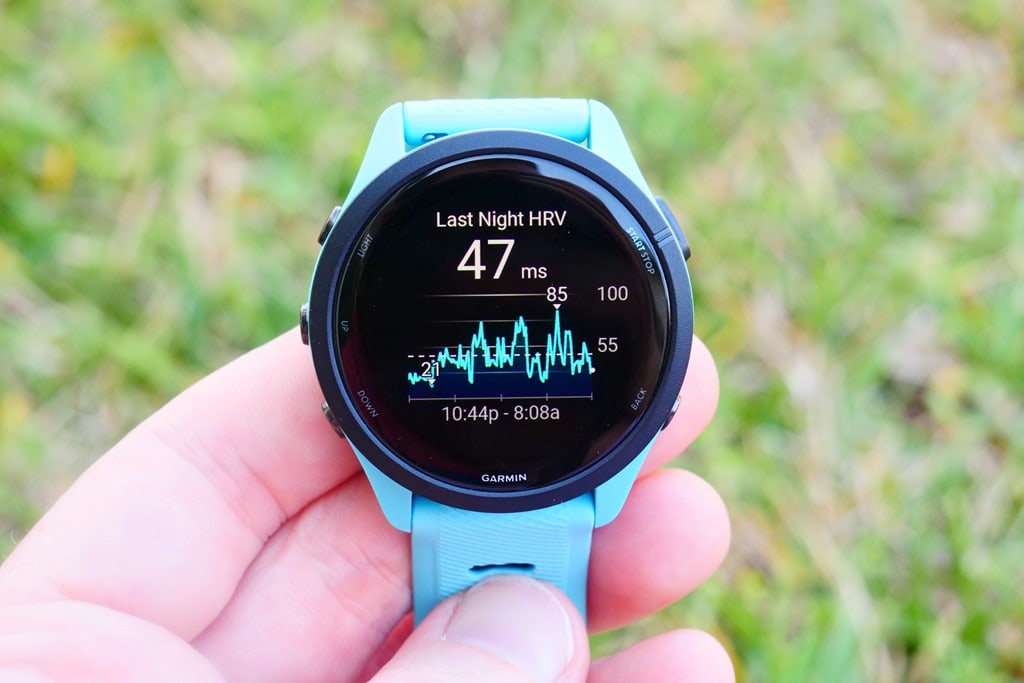
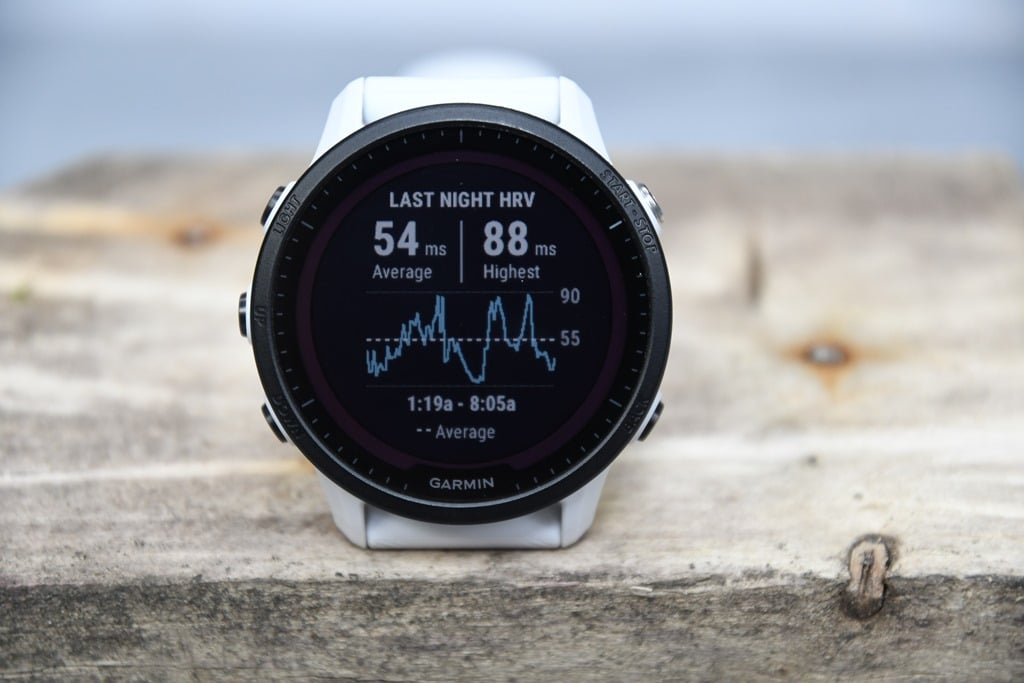
Meanwhile, the Forerunner 265 includes HRV tracking, like the Forerunner 255 before it. HRV is measured constantly through the night. Garmin takes constant readings, and then displays them in 5-minute increments within the HRV timeline graph shown. That chart also shows your max values for the night. It’s 100% normal that there’s this much fluctuation in it, as your values are often tied to different sleep phases.
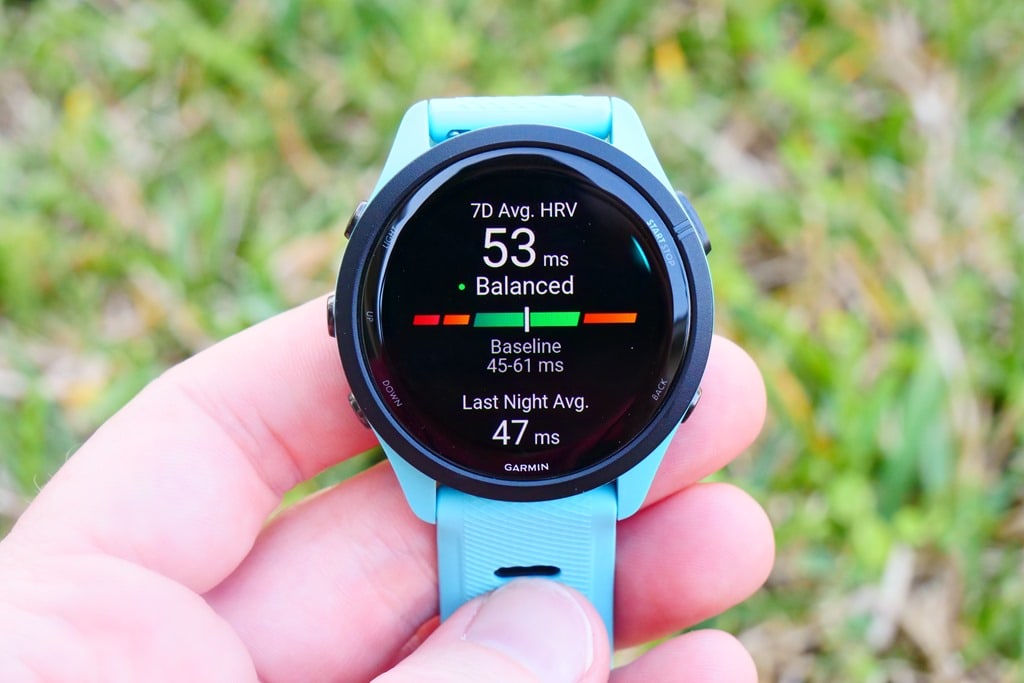
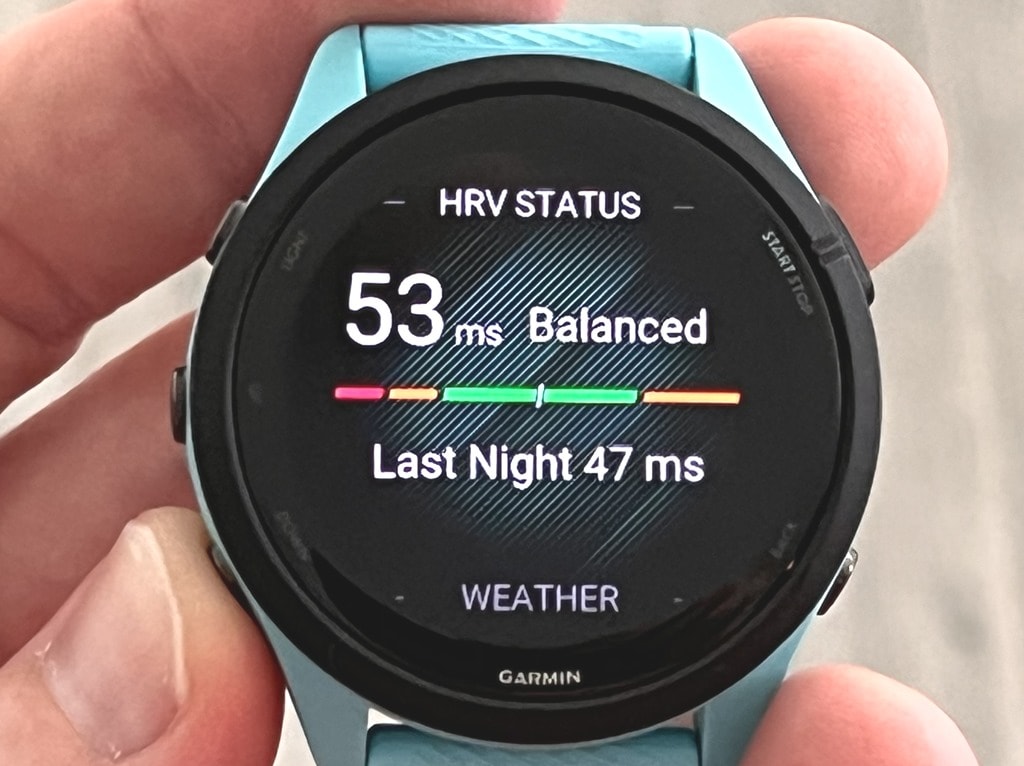
However, this is just the first snippet – and is the nightly HRV values. These are interesting, but not as useful as plotting it over time. So that’s where Garmin’s HRV Status feature comes in. This requires 19 nights of data before it starts tracking, as it’ll establish your baseline. That baseline is unique to you, and will shift slowly over time on a 90-day rolling window. The general gist is that if you’re within your green zone, it’ll show ‘Balanced’, but then you can become unbalanced over time (either high or low).
Keep in mind that a single ‘bad night of data (such as after heavy drinking), won’t immediately impact your HRV Status. It’s not supposed to. Neither should a heavy training weekend. Instead, you’ll see the dip reflected on your trending charts. But sick for a week with a low HRV value? That’ll probably do the trick. But again, that’s kinda the point. As for the accuracy of the underlying data, back in my Forerunner 955 review, I compared the HRV data to a Polar H10 chest strap, and found it very similar. The Forerunner 265 uses the same exact sensor/algorithms/etc as the Forerunner 955 from this test below. Maybe I’ll re-do it shortly on the FR265/FR965 for fun.
(Above is a very rough visual comparison between a Polar H10 worn throughout the night and the Garmin FR955. I say ‘rough’ because to begin, the SDNN isn’t exactly the same as what Garmin records as SDRR, as Garmin’s is error corrected. Second, the scales aren’t the same here. Further, trying to get a chest strap to have good connectivity the entire night isn’t actually super easy. So, in the same way that sleeping on your side/wrist can impact wrist values, so can movement where the strap might not be perfectly placed at some random point in the morning. Nonetheless, the averages recorded are within 2ms. The Polar’s average for the night was 52ms, while the Garmin’s was 54ms. If I can find better ways to get the data out of Garmin’s platform, I can look to do other comparisons.)
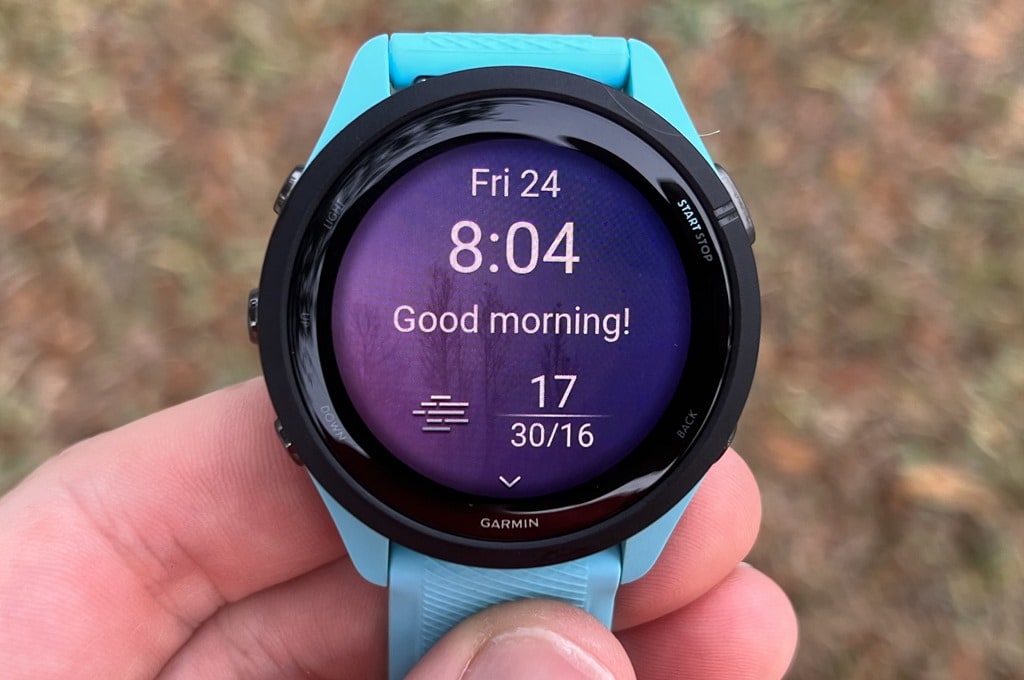
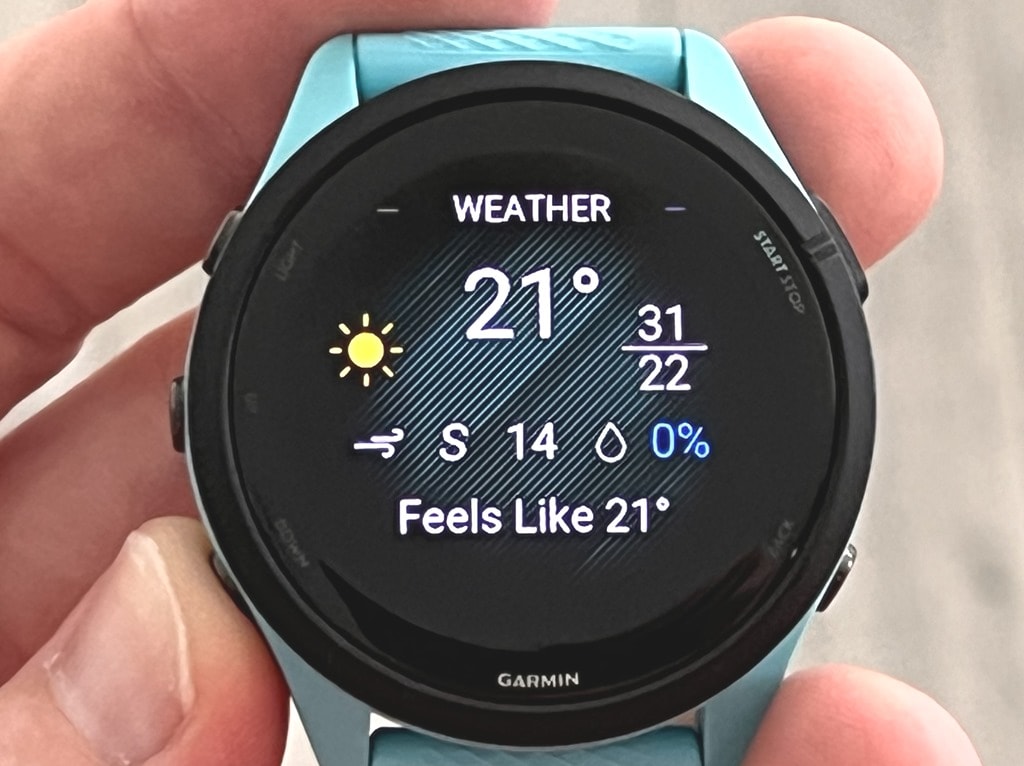
Moving along, one favored feature introduced last year is Garmin’s Morning Report. This watch overlay appears when you wake up each morning, and shows a small collection of relevant data for the day ahead. It includes HRV Status, Training Readiness, Sleep, planned workouts, the weather, and more. You can customize this with which data you want, or disable it entirely. Though, it’s probably one of my favorite features:
You can start to see little bits of the UI redesign here in the Morning Report. Here’s this morning, after a very long night of sleep last night (I only got two hours of sleep the night before, preparing the Forerunner 965 review) – hence why the training readiness score is still a bit low here despite the good sleep.
Even clever things like on a foggy morning, actually showing fog on the back of the morning report ‘welcome’ screen. Here above is a photo taken outside showing the fog in the trees matching the fog on the watch (seen above where it shows ‘Good Morning!’).
It’ll also do things like wish you a happy birthday, good luck for a planned race, and a number of other things throughout the year. In fact, notably, if you do have a planned race, it’ll hide Training Status/Readiness components from you that morning (in the morning report). The idea being that seeing that data (if bad) won’t change your race any – it’ll just potentially discourage you.
Now, we’re gonna start to round home here on a few features and go back towards more of the smartphone-related features. First up is smartphone notifications. These show incoming notifications from your phone, as you’ve configured by your phone. Garmin has gotten much better in the last year or two with emoji, now showing most of them. Note that with an iOS device, you can’t reply to these notifications due to limitations imposed by Apple. You can dismiss them though.
Meanwhile, the watch supports both Garmin Pay & offline music. At this point, both of these features are pretty much mainstream across many of Garmin’s watches. For the music side, you can add offline music from Spotify, Amazon Music, and Deezer – as well as MP3s and podcasts (though frankly, it’s way easier/faster to do podcasts via Spotify offline on the Garmin watches).
Whereas for the Garmin Pay contactless payments, you can load credit cards from any number of different banks. There’s a huge list of them here. In short though, for the US you’re pretty well covered, whereas for the rest of the world, it’ll vary quite a bit. It’s kinda hit or miss. Once you’ve got it loaded though, you can simply tap the watch against a NFC/contactless payment terminal to pay wirelessly.
Lastly, we get to the charging/battery elements. In this case, you’ll charge via the new USB-C Garmin charging cable included in the box. This is the same Garmin charging connector as before, except the other end of the cable is USB-C. There is no wireless charging here.
Charging times are the same as the Forerunner 965/955, which are a touch over an hour for charging the Forerunner 265 watch. While that’s not quite as fast as the latest gen Apple Watch units, it’s on the faster side of things for Garmin (compare that to a Garmin Fenix/Epix unit that takes nearly two hours).
When it comes to real-world battery life, we’ll start with the battery specs from Garmin, and then go from there to what I’m seeing in the real-world. Here are those specs first:
Forerunner 265S
Smartwatch mode: Up to 15 days
Smartwatch mode (always-on display): Up to 5 days
GPS-Only GNSS mode: Up to 24 hours
SatIQ (AutoSelect) GNSS mode: Up to 18 hours
All-Systems GNSS mode + Multi-Band: Up to 15 hours
GPS-Only GNSS mode with music: Up to 7.5 hours
SatIQ (AutoSelect) GNSS mode with music: Up to 7 hours
All-Systems GNSS mode + Multi-Band with music: Up to 6 hours
Forerunner 265
Smartwatch mode: Up to 13 days
Smartwatch mode (always-on display): Up to 5 days
GPS-Only GNSS mode: Up to 20 hours
SatIQ (AutoSelect) GNSS mode: Up to 16 hours
All-Systems GNSS mode + Multi-Band: Up to 14 hours
GPS-Only GNSS mode with music: Up to 7 hours
SatIQ (AutoSelect) GNSS mode with music: Up to 6.5 hours
All-Systems GNSS mode + Multi-Band with music: Up to 6 hours
In my testing, I’m using the always-on display option at default brightness (2/3rds – the same as all photos in this review). I use sleep-mode (also default) at night. For my workouts I’m using SatIQ (default), which automatically leverages multiband GNSS when it needs it, and uses less power-intensive GPS when it doesn’t. During this time period I’ve been averaging 1-3 hours of GPS workout usage per day, and when cycling that includes a cycling power meter connected. Some of the workouts have structured workouts enabled, some running ones have had a course enabled.
For day-to-day usage, I’m on trend for about 1%/hour average, which puts me at a touch over 4 days always-on smartwatch mode, including all of that GPS workout time. When it comes to GPS workout battery burn, I’m definitely getting better results than their spec (which is 18 hours for SatIQ). Take, for example, this 2-hour cycling workout (with a power meter), my battery burn rate puts me on course for about 24 hours of battery life, thus 6 hours more than expected:
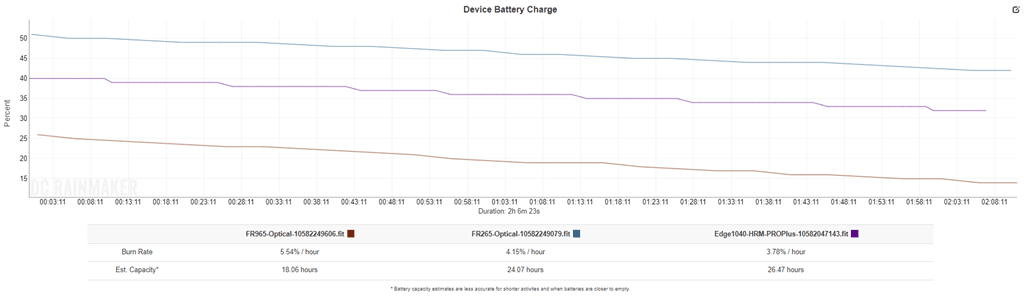
(Note for both of these charts that the FR965 battery data is from the unit I was having battery problems with, I’ll refresh these charts shortly with some longer workouts on the replacement unit to see if it changes, which it hopefully does. Speaking of which, these charts are created automatically using the DCR Analyzer tool, allowing you to drag in any Garmin/Wahoo/Hammerhead data file and it’ll plot the exact battery burn times based on what’s written to the .FIT files. Note that longer files are better for predictive estimations, because there are more battery % changes shown).
And then here’s a 75-minute run, including some portions in the jungle, with course/route following enabled, showing on par for hours:
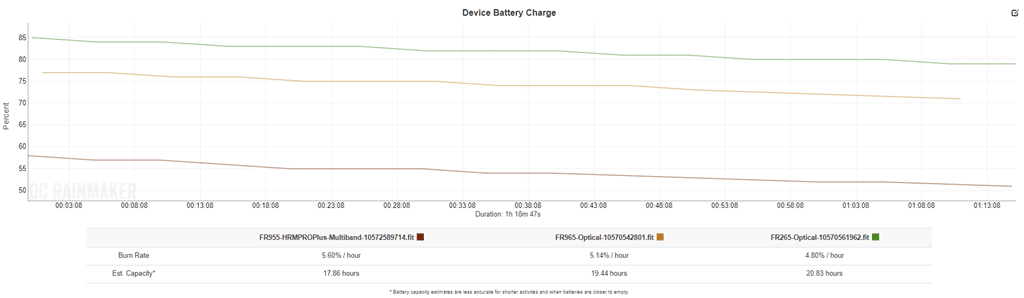
I haven’t quite had a chance to collect all of my wife’s battery data from the Forerunner 265S and her workouts, but I’ll do so shortly and add it in here.
Sports Usage:
When it comes to Garmin watches, there’s a strong chance you’ll never use 95% of the sports features in them. The amount of features is staggering, and thus, so is the combination potential between those features. With everything from training load to recovery, or custom workouts, or routing/course features, race pacing features, and plenty more outside of that and with subcategories of it.
The point being, which 1-5% of the features you’ll use will vary wildly from person to person. I use sports features every day that others never use, and vice versa. It’s fundamentally why they lead this category. And perhaps more importantly, over the last few years, the software quality has increased substantially, largely through open firmware beta programs that go on for months. Certainly, Garmin still has bugs (like any other company), but unquestionably things have gotten better in the last few years.
In any case, to start a workout, you’ll go ahead and tap the upper right button, which brings up a list of sports. You can pin your favorite sports to the top of the list, making it easier to get to:
Here’s a complete list of the sport modes currently listed on the Forerunner 265 (some are technically not sports, but fall under sports modes in the Garmin world, like Connect IQ App Store):
Run, Track Run, Ultra Run, Virtual Run, Treadmill, Indoor Track, Trail Run, Treadmill, Bike, Bike Indoor, eBike, MTB, eMTB, Pool Swim, Open Water, Hike, Ski, Snowboard, XC Classic Ski, SUP, Row, Row Indoors, Walk, Strength, Cardio, HIIT, Yoga, Pilates, Breathwork, Elliptical, Stair Stepper, Clocks, Floor Climb, Other, Triathlon, Health Snapshot, Connect IQ App Store
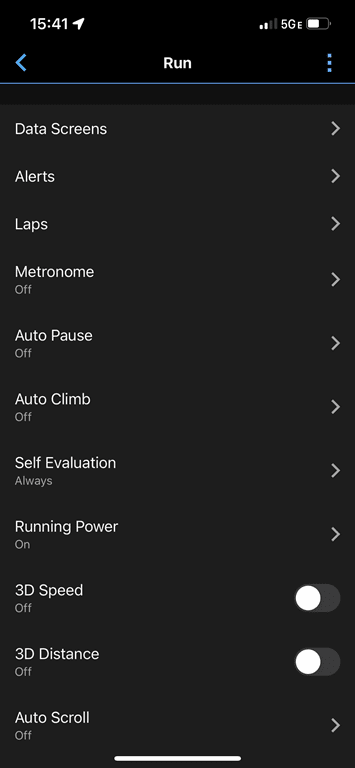
Each of these sport profiles are customizable, be it things like the data pages and data fields, or the aspects like auto-lap or auto-pause, zone alert settings, or even ancillary settings like whether or not you have running power enabled and which sources it comes from. Every sport has a slate of these that can be tweaked, and you’ve got two main ways you can tweak them. First, is on the watch itself, and second is on your smartphone.
The Forerunner 265 allows you to customize each of these from both the watch itself, as well as from the Garmin Connect Mobile smartphone app. About the only features you can’t customize from the Garmin Connect Mobile app are the downloaded maps, or sensors. You have to do that either from the watch itself (maps & sensors), or from a computer (maps). But everything else is covered. You can do this via the device settings and then the activity type:
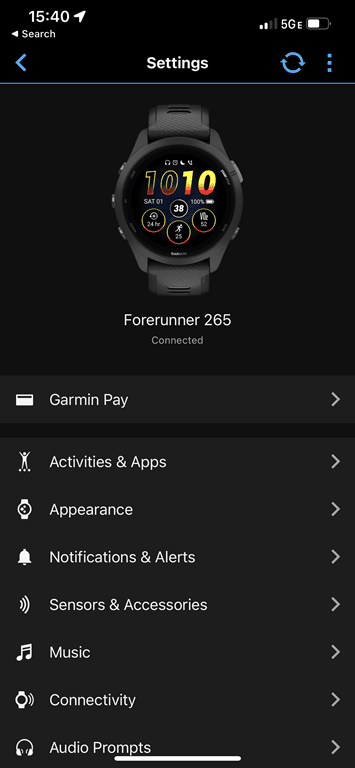
The depth that you can go into here is just like on the watch, and the menu system loosely follows that too. Again, this is sorta Garmin’s thing in life – a million options. 99% of them you’ll never touch, but if that 1% feature is your favorite feature, then it’s the most important thing to you. That’s fundamentally why Garmin has done so well over the years – even if it’s sometimes at the expense of ease of use.
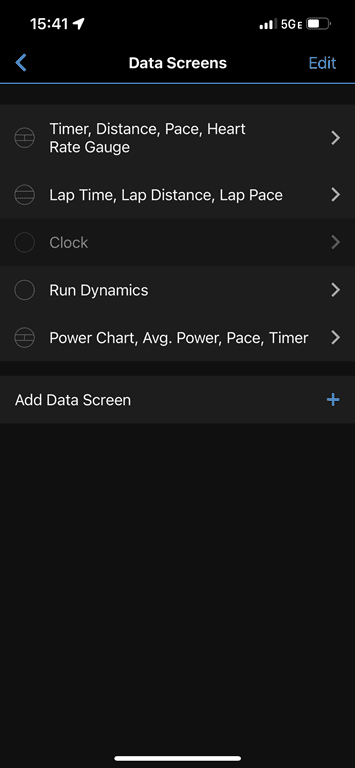
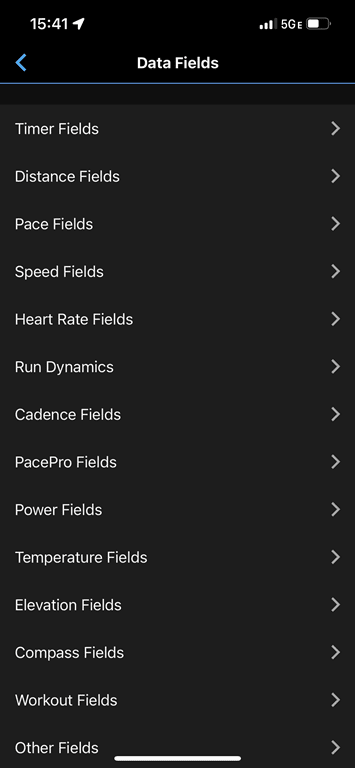
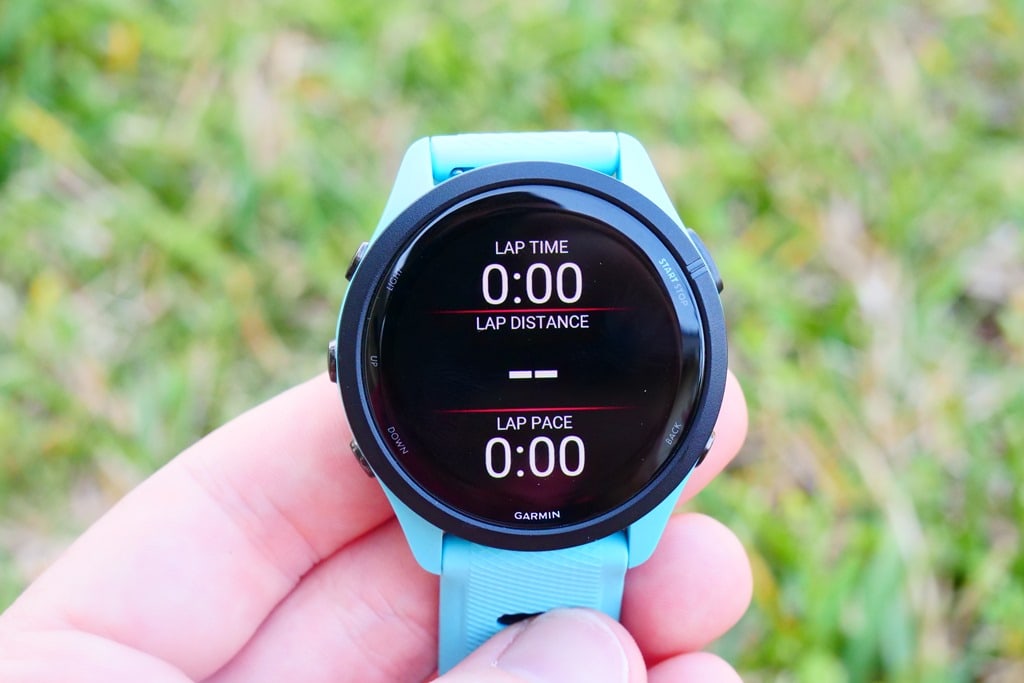
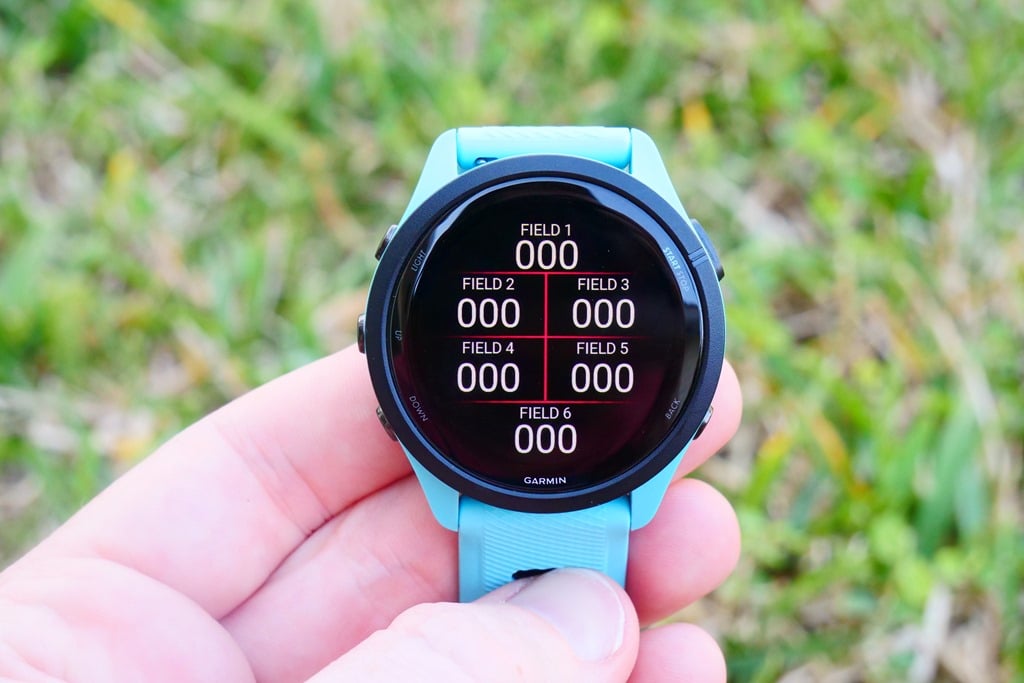
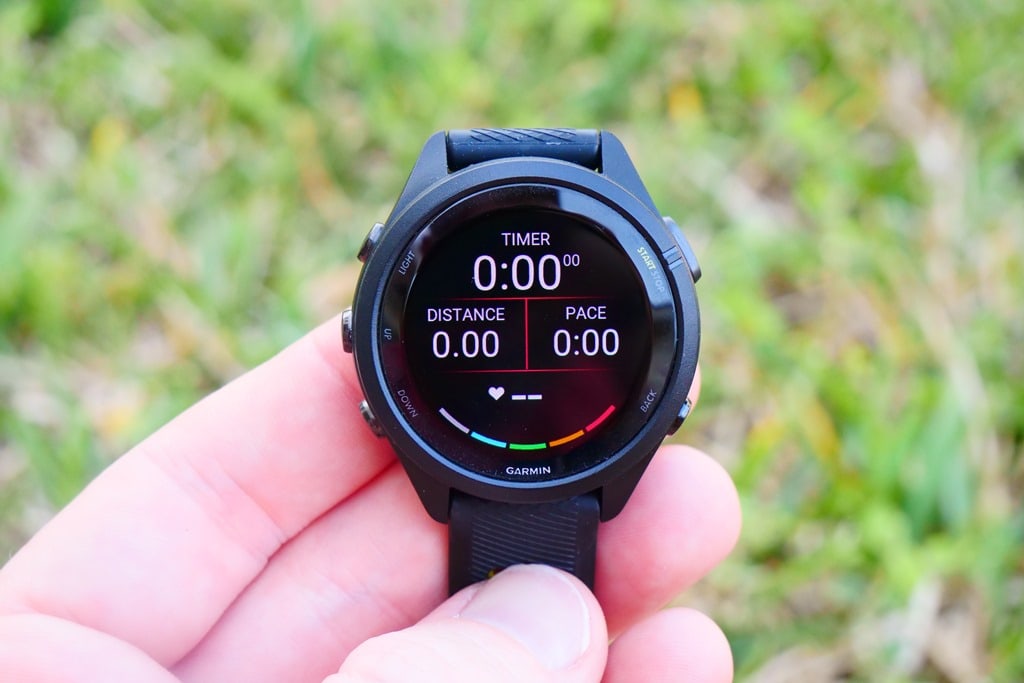
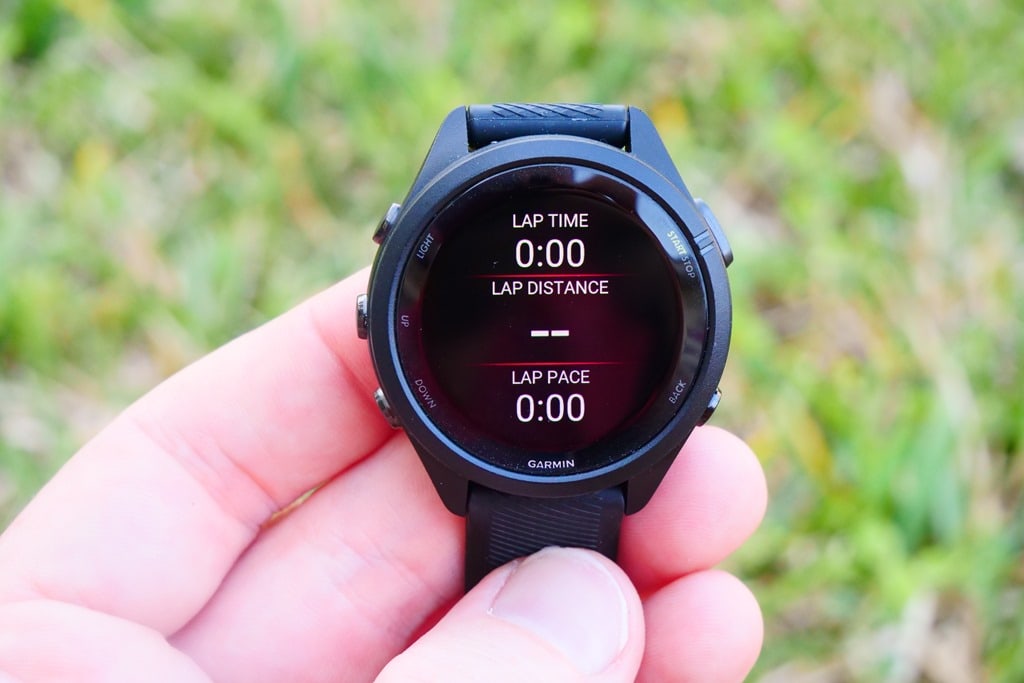
The Forerunner 265 supports 6 custom data fields per page, and has no meaningful limit on the number of custom pages you can create per sport profile. There are additionally various stock graphical pages and gauge pages, like heart rate gauges, running dynamics data pages, or a run power data gauge.
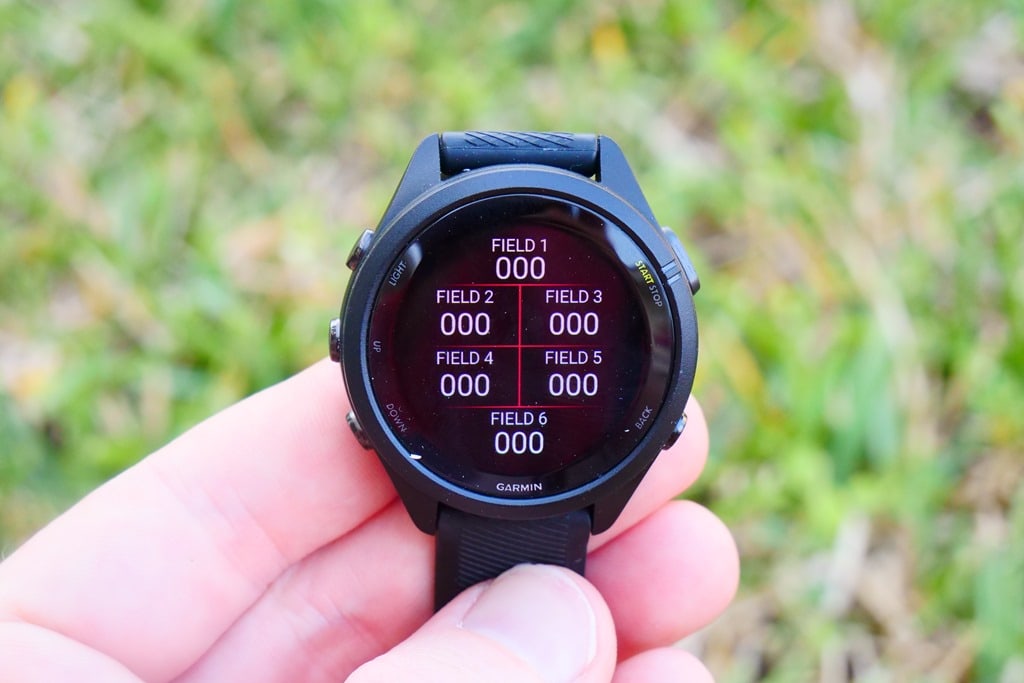
Here’s another set on the FR265S, also supporting six fields:
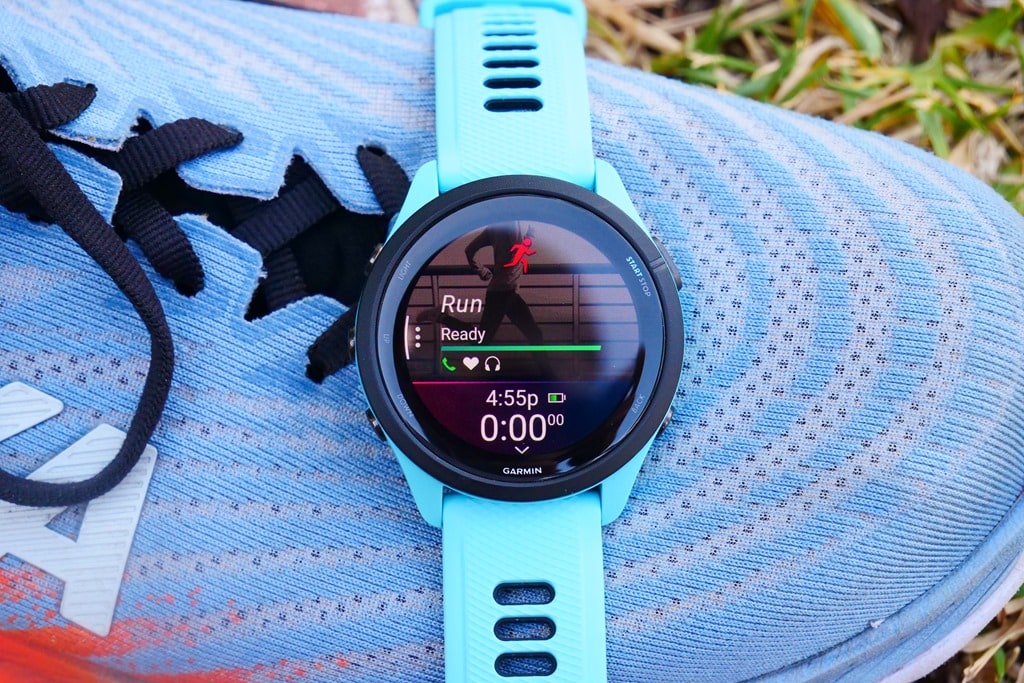
Once you’ve customized everything till your heart’s content, you’ll be ready to actually do the workout you’ve been dreading. Upon picking the sport mode you’ll see the new and revamped sport-ready page. This shows the GPS satellite status, heart rate sensor readiness, connected sensors (like a cycling power meter), as well as LiveTrack status (if a phone is nearby).
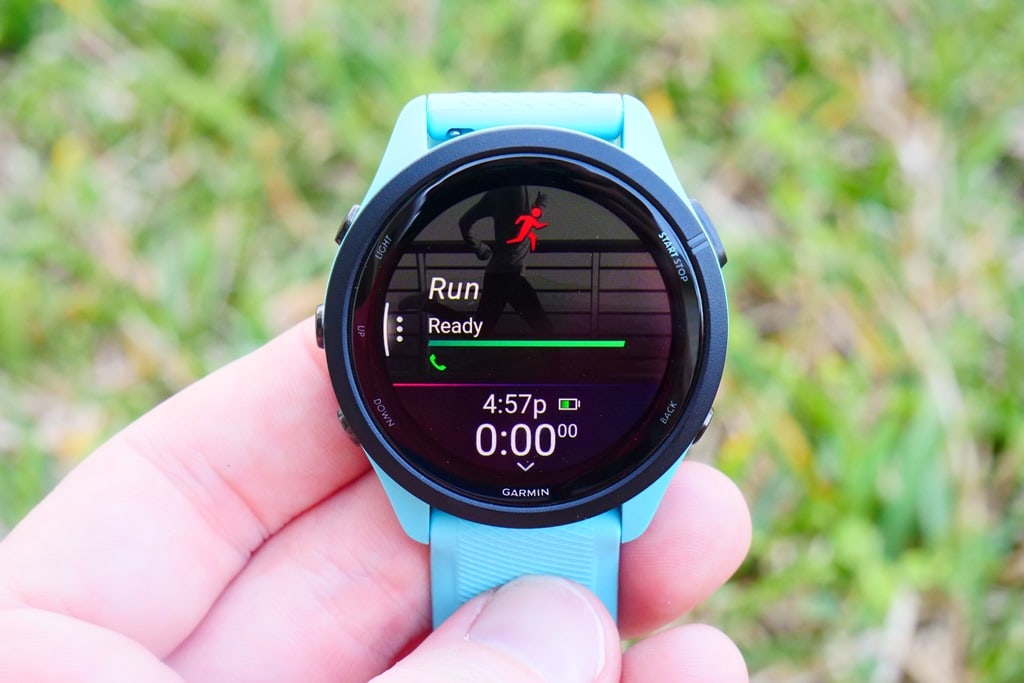
At this point it may have offered you a Daily Suggested Workout (for Running/Cycling), or, if you had a structured workout pushed to it from platforms like Training Peaks, TrainerRoad, Garmin Connect Calendar, etc… it’ll show you those. The built-in daily suggested workouts are driven by the goal of making you faster via figuring out your current training load baseline. Alternatively, if you had loaded a race onto your calendar (running/cycling), it’ll give you a training schedule aimed towards that goal.
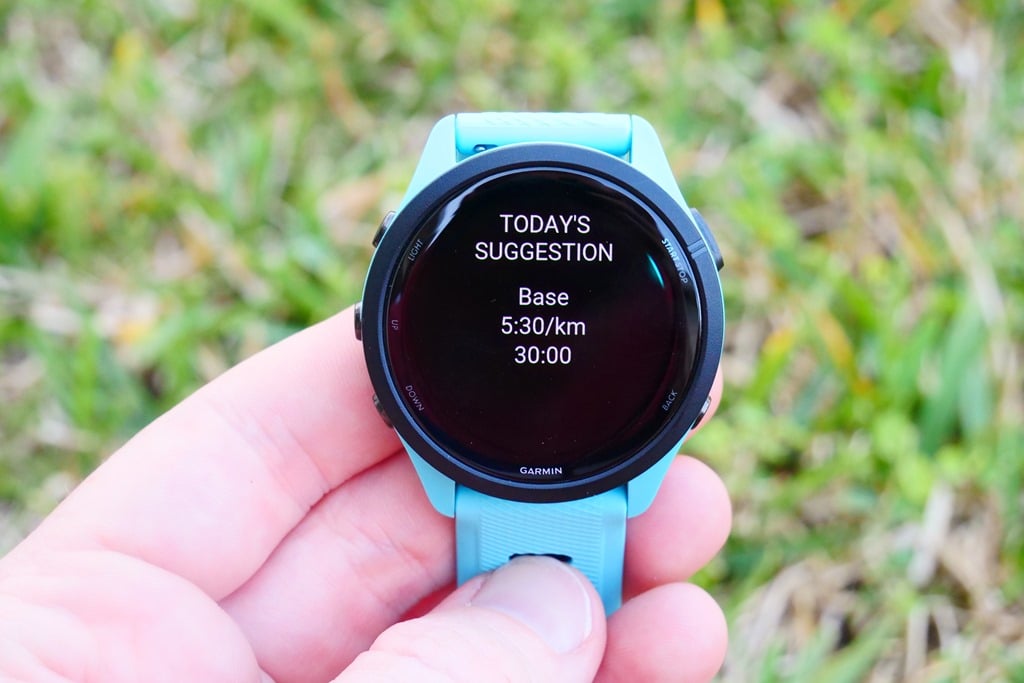
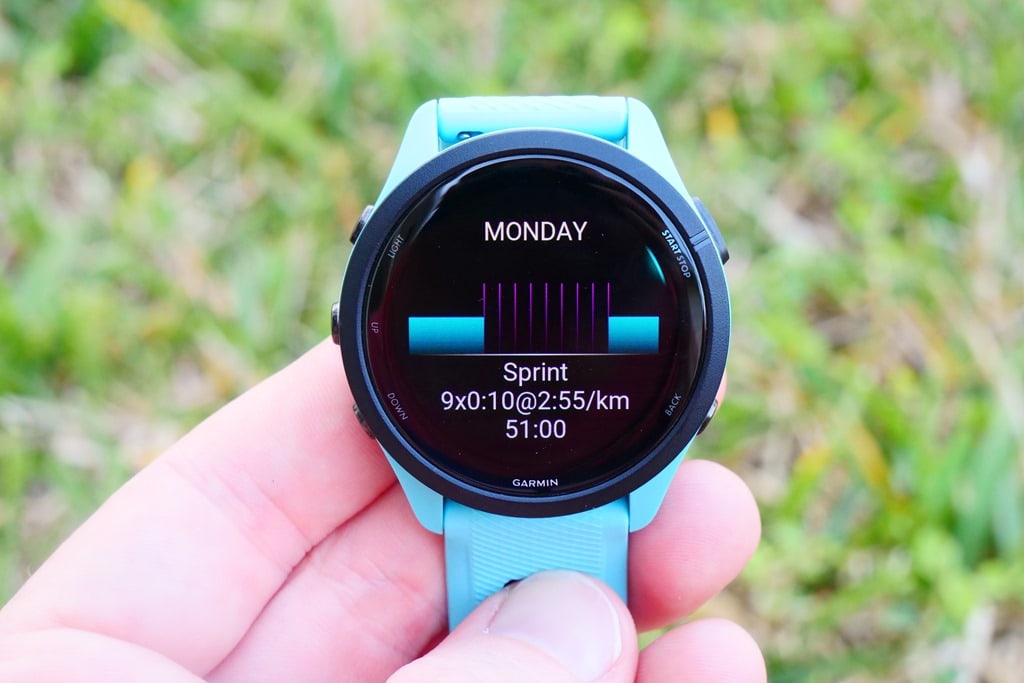
At present, these running workout suggestions are based on either heart rate or pace. They are not currently based on power, though Garmin does report running power. And for cycling workouts, they are based on cycling power.
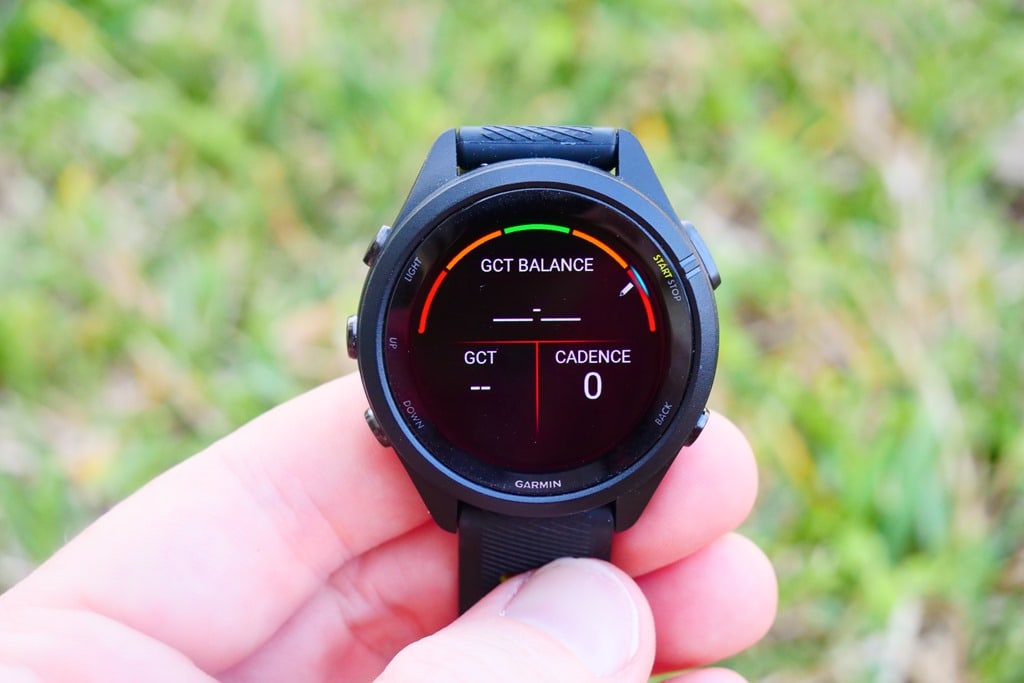
Once you either select one of those (or not, or create a manual interval workout, PacePro race plan, etc…), you’ll be off to the races. You can iterate through the data pages you’ve configured, such as those seen below with the Running Dynamics natively via the wrist:
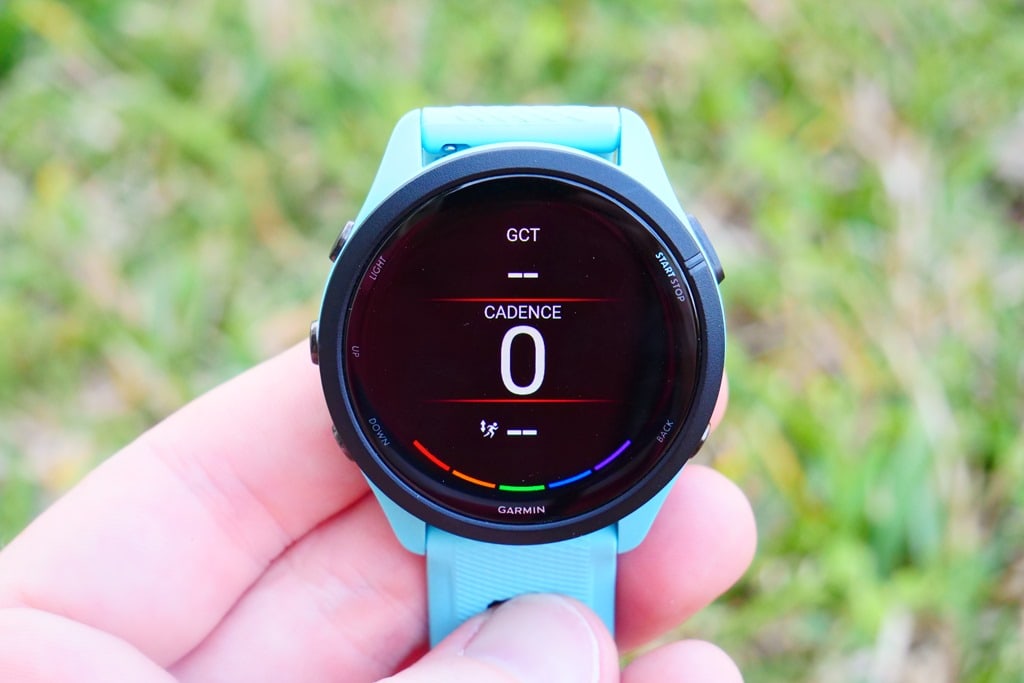
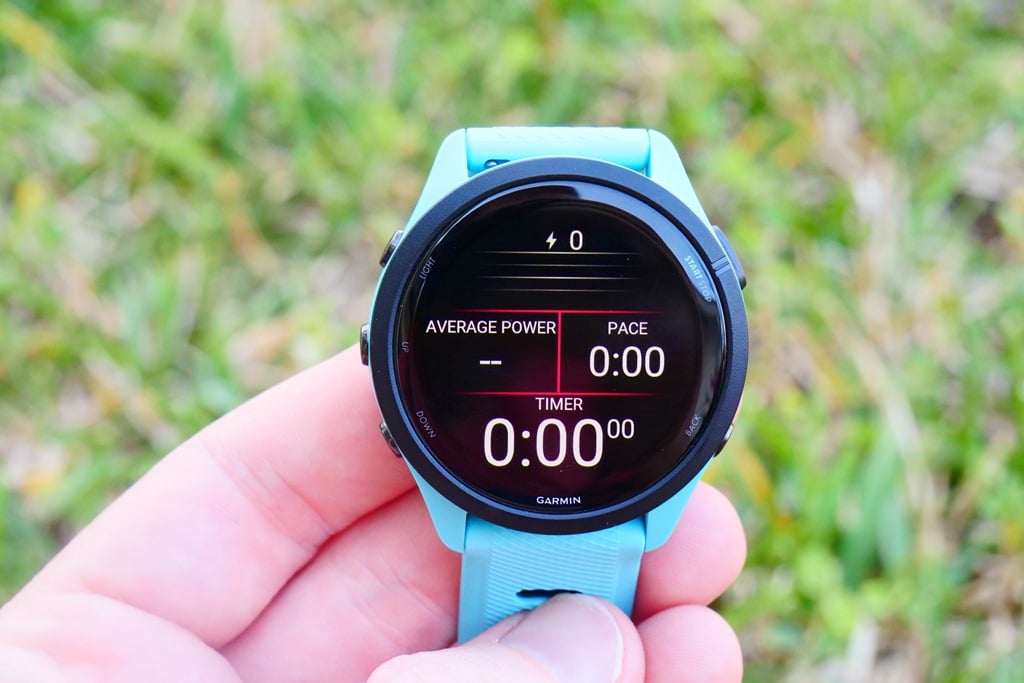
Sidestepping topics slightly, there is built-in running power. I’m not going to rehash running power here, or Garmin’s implementation of it. I’ve done that many times. All you really need to know is there is no standard in running power (across the industry), specifically in what is or isn’t included, and thus, different watch companies do it differently and arrive at different levels. Likewise, there’s no physiological reason for cycling power and running power to ‘match’. In fact, there are a lot of good reasons for them not to match. But all that’s neither here nor there. What is here, though, is that the Forerunner 265 includes native wrist-based running power, which means no extra sensor is required. You just run, and it displays it in real-time during the run, and records it afterwards:
If you want to turn this off, you can. Alternatively, if you want to use an external Garmin sensor, you can. Both of these are options in the settings. At this time, it still doesn’t support external non-Garmin running power sources (such as Stryd), though Garmin has previously said they aren’t opposed to it (as they do so for cycling power just fine). You can still, of course, add the Stryd data field/app to it as you see fit, just like with past Garmin devices. Hopefully, someday down the road, Garmin will support 3rd party running power sensors in the same way they support 3rd party cycling power sensors.
The main appeal to the Garmin native implementation is that it’s fully supported across things like structured workouts, data fields, and various other charts. That includes the following data fields you can add:
– Power
– Power Gauge
– Avg. Power
– Lap Power
– Last Lap Power
– Max. Power
– Power Zone
However, new to the Forerunner 265 and FR965 (and all Garmin watches) is wrist-based Running Dynamics. To be clear, Running Dynamics are not new, but no longer requiring an external sensor for Running Dynamics is new. Running Dynamics are things like Ground Contact Time and Vertical Oscillation. This previously required a Garmin external sensor like the HRM-PRO, HRM-RUN, HRM-TRI, or RD-POD. None of those are required anymore (though you can still continue to use them as a data source). Instead, you’ll see the Running Dynamics data on the watch, as well as on Garmin Connect, without any such sensors – like below (and chart above):
Note that I dive into the Running Dynamics wrist-based accuracy later in the review, for those that are interested (towards the end of the HR accuracy section, a quirky place to put it, but hey, that’s where it ended up).
Frankly, all these years later and I’m still not super clear on what I’m supposed to do with this data in terms of training or racing. But hey, at least it’s here now without needing to buy any external sensors. Undoubtedly Apple adding this natively to their watches last summer/fall played a (massive) hand in Garmin doing the same. There are still reasons to buy an HRM-PRO Plus HR strap, such as better swim heart rate tracking, or other metrics without a watch on your wrist. But for most people, those will be edge cases.
Speaking of sensors, the Forerunner 265 maintains the same list of sensors as the Forerunner 255, which is basically every ANT+ or Bluetooth Smart sensor type you’d ever want to pair to it. And even those that aren’t supported natively are supported via Connect IQ apps on the watch. For example, you can add Core body temperature sensor data field apps, or NIX hydration sensing apps, or aerodynamic cycling sensor apps, and so on. It’s again, a huge strength of the Garmin platform these days. But as for the native sensor list, here ya go:
eBike (ANT+), Extended Display (ANT+), External HR (ANT+ & Bluetooth Smart), Footpod (ANT+ & Bluetooth Smart), Headphones (Bluetooth), Cycling Lights (ANT+), Power (ANT+ & Bluetooth Smart), Cycling Radar (ANT+), RD Pod (ANT+), Smart Trainer (ANT+), Speed/Cadence (ANT+ & Bluetooth Smart), Tempe (ANT+), VIRB (ANT+),
For fun, here are the added sensors types also seen on the Forerunner 965, which are missing on the Forerunner 265:
inReach (ANT+), Muscle O2 (ANT+), Shifting (ANT+), Shimano Di2 (Propriety ANT), Golf Club Sensors (Garmin)
Additionally, there are some subtle quirks between the FR265 and FR965, specifically in the realm of Garmin cycling power meters (Rally/Vector), whereby the Forerunner 265 series does NOT record the Cycling Dynamics data, but the Forerunner 965 series does. To be clear, it still reports all of the regular cycling power/cadence information, but just not the Cycling Dynamics specific data stream, including Platform Center Offset and related. I have no idea why, since the equally priced Instinct 2 lineup does this just fine. And for that matter, the Instinct 2 also connects to the inReach just fine, though I can kinda (barely) see why Garmin would focus it on the Instinct series, but realistically, as the Forerunner 265 is a far more capable watch than the Instinct 2, I’d have expected Garmin to appeal to also-Garmin-purchasing inReach owners.
As with before, you can save multiple sensors of the same type, and give them custom names if you want. For example, I’ll name one bike’s power one thing, and another bike’s another thing, and so on.
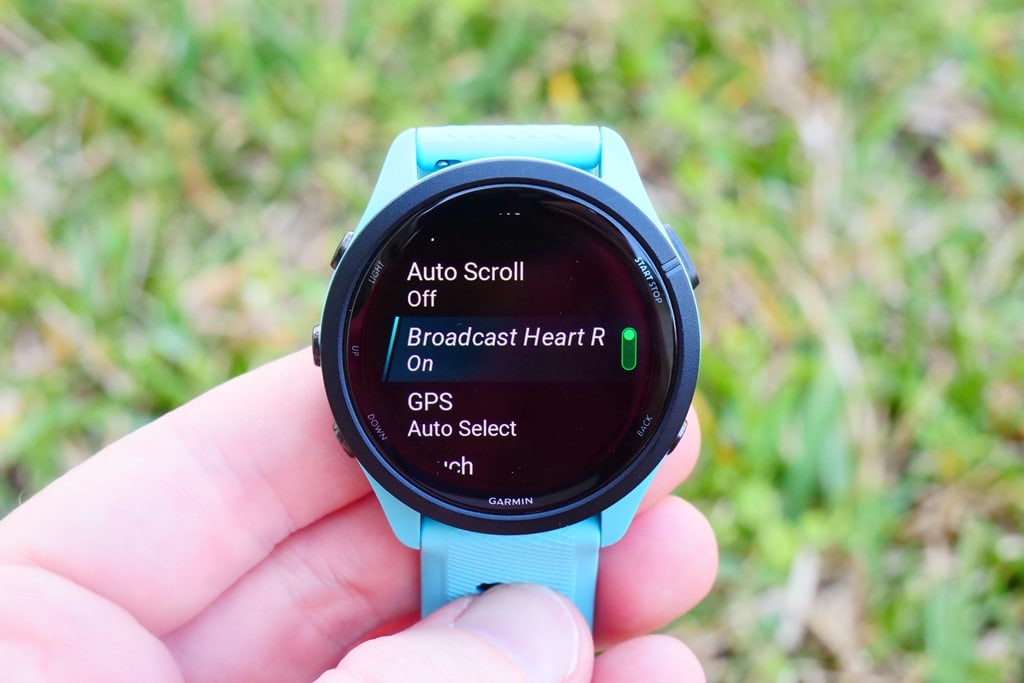
Inversely, you can also broadcast your heart rate from the Forerunner 265 to 3rd party apps/devices, using standard ANT+ & Bluetooth Smart. For example, if you want to broadcast it to Zwift or Peloton, you can do that with the touch of a button. Likewise, you can broadcast it to your Garmin Edge device (or any bike computer). I’ve set up certain profiles (indoor cycling), for example, to automatically broadcast my HR, so I can pick it up on Zwift if I want to. And in the case of running, you can also broadcast your running pace for indoor treadmill running (again, with Zwift).
Now, with all that working out done, you can save your workout. You’ll get a summary of the workout on the watch as a starting point, in a bunch of graphical pages:
Additionally, you can see even more data afterward on Garmin Connect (app or website), like so:
Further, if you’ve got 3rd party apps like Strava or TrainingPeaks, you can configure your account to automatically forward the workout files to those apps, which shows about 1-2 seconds later (for real). It’s super easy, and is how I configure my accounts (in my case though, I also set my Strava to be ‘Private’ by default for all new activities, so I can update them later as I see fit).
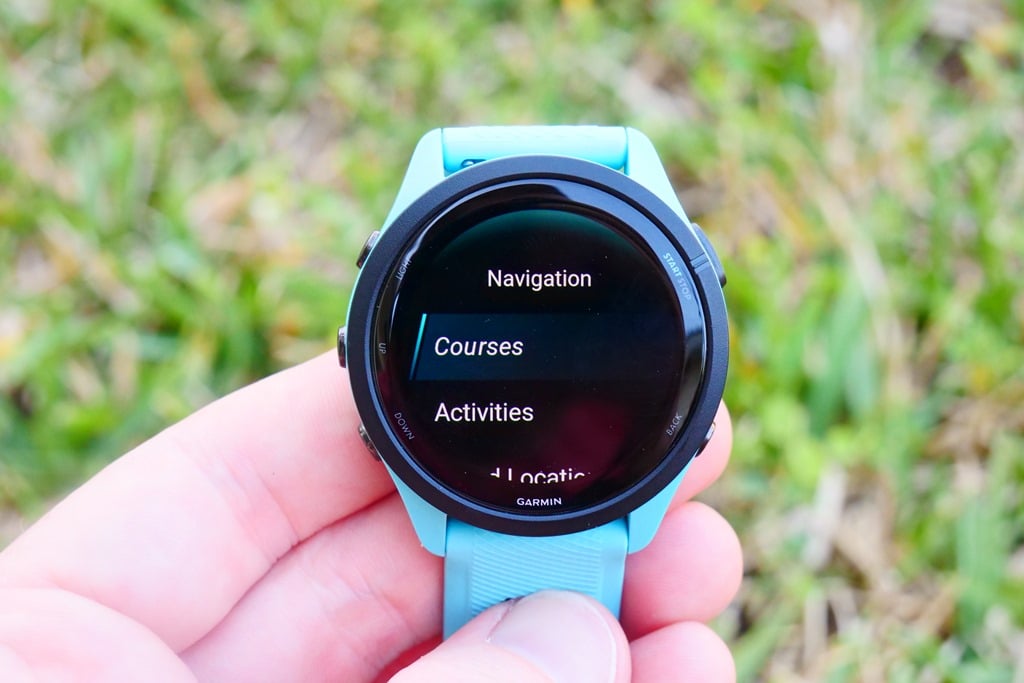
Now, I do want to mention briefly that the Forerunner 265 can follow a course/route. However, it does not have mapping built-in. Instead, you can import courses from Garmin Connect, GPX files, or any 3rd party connected site (Strava/Komoot/etc…). Additionally, you can also route past activities, directly to a saved location (as the crow flies), or to a GPS coordinate (as the crow flies).
In my case, I tend to create my courses on either Strava, Komoot, or Garmin Connect directly. From there, they just automagically sync to the watch and show up in the courses menu:
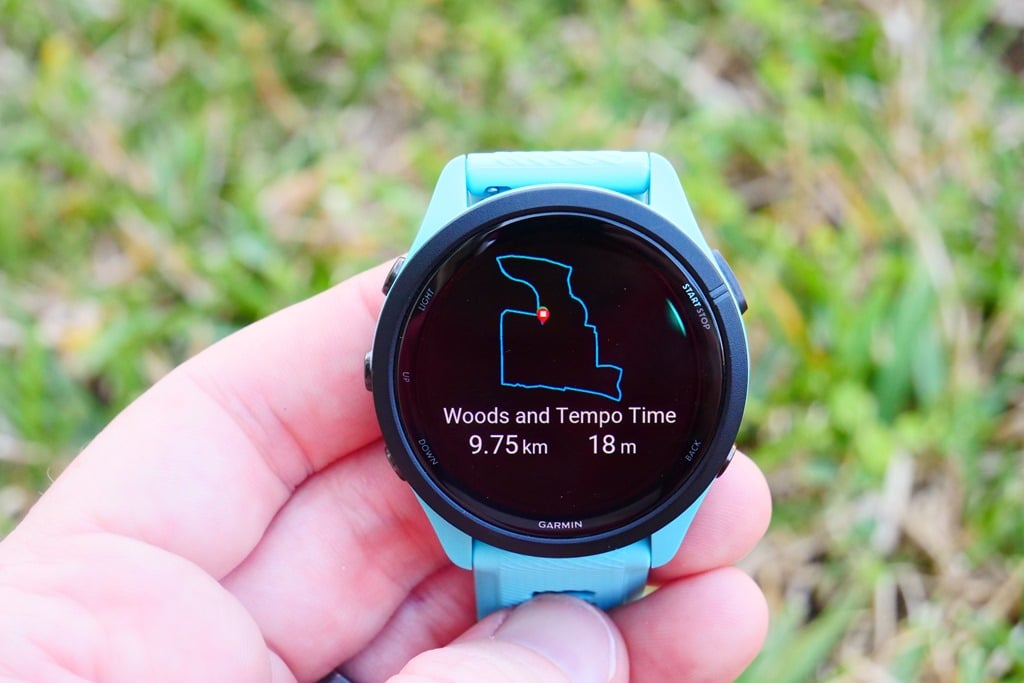
Once loaded, you’ll follow a breadcrumb trail and a little compass heading. It’ll notify you how far till the next turn, and usually how much distance is remaining on the course. I hadn’t noticed when I took this photo that the total distance remaining was missing here. Not sure if that was a split-second blip or what:
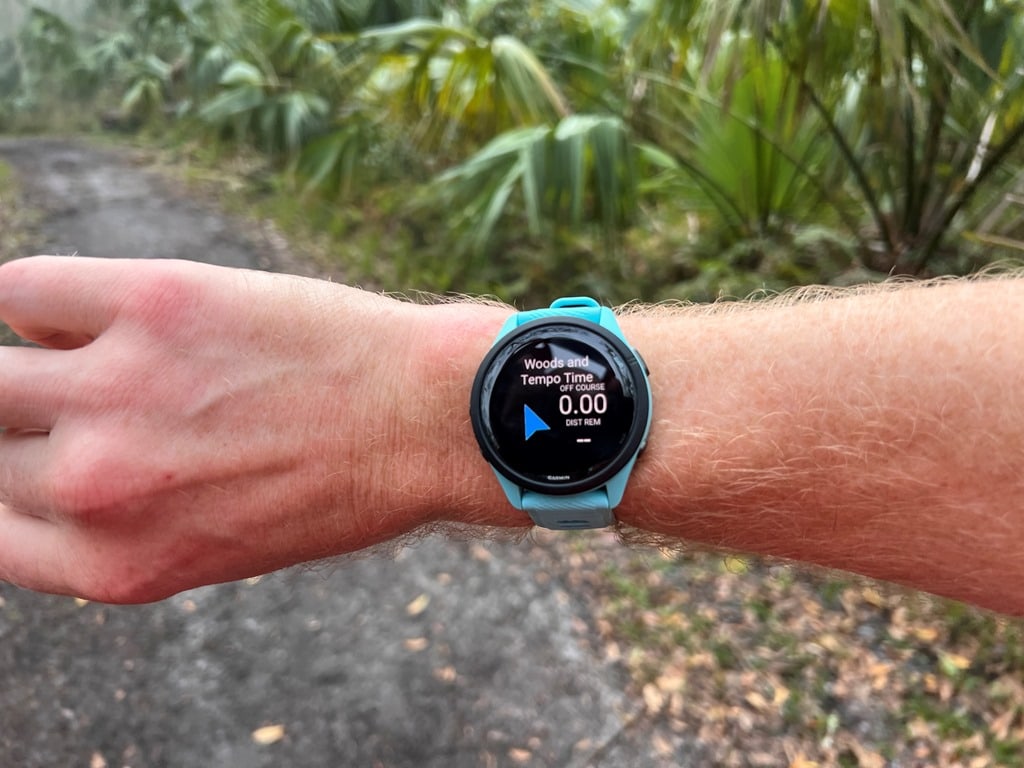
But you can see the route I made through the jungle, and me following it along just fine. I didn’t get attacked by any panthers this day, though the next day was more questionable with a Bobcat. Below, showing me 95.2 meters till the next turn.
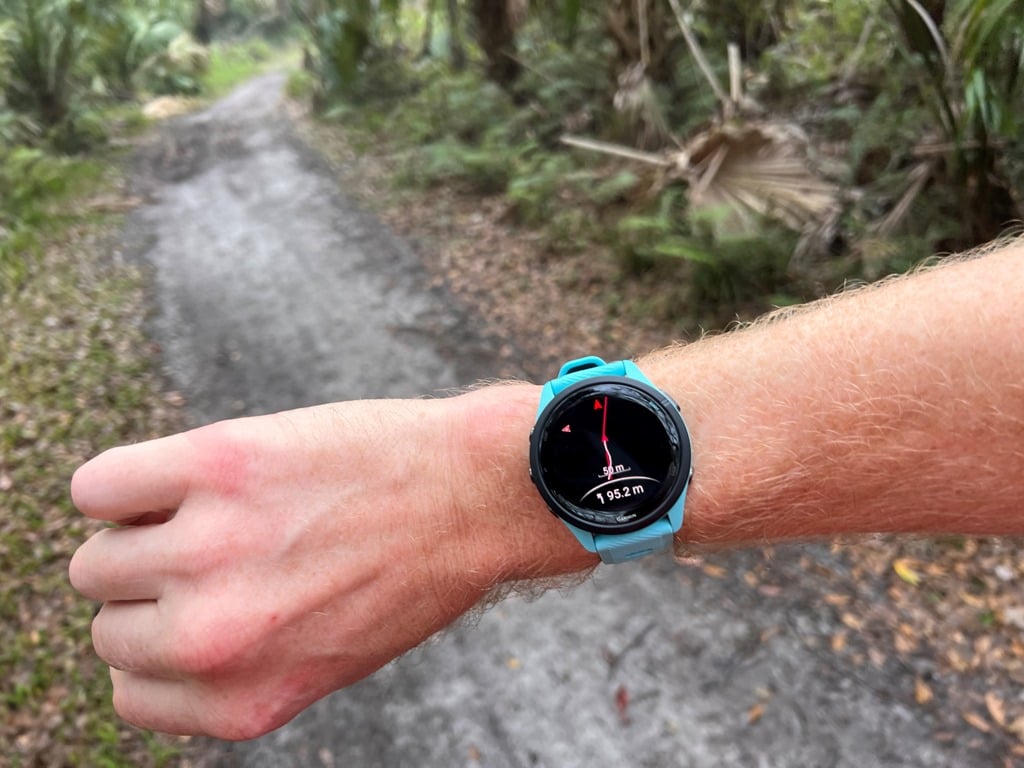
So with our workout complete, let’s dive into the training load and recovery metrics – as that’s an entirely different ball of wax to deal with.
Training Load/Recovery Metrics:
While the previous Forerunner 255 has Garmin’s so-called ‘Training Status’ feature set, the new Forerunner 265 gets a significantly better suite of feature set in ‘Training Readiness’. To be clear, both features are in the Forerunner 265 and complement each other, but Training Readiness makes it easier to figure out whether, or how hard, to train each day.
Of course, there’s a lot to take in here, but in a nutshell, last year Garmin significantly revamped how Training Status, Training Load, and a slew of related metrics work. At first glance, you’d likely just see the new Training Readiness and HRV Status metrics and assume everything else was the same. But there were fundamental shifts to those metrics that try to lessen the chance you’re going to get an Unproductive message when you’re simply in a hard training block. And if we look at the success of that some 8 months or so later, most people would agree Training Readiness is a massive step forward, and arguably leads the industry in how to present endurance sports load/recovery data.
As with all training load/recovery algorithms or concepts, there are still edge cases and quirks. There always will be. This is no different than a coaching philosophy; there will always be different opinions on how to train.
First, though, we’ve got a couple of core concepts to explain briefly, and then in more depth in the rest of this section:
Training Readiness: This metric aims to be your one-stop shop to decide whether or not to train that day. It blends Sleep (vs both short and long-term history), Recovery Time, HRV Status, Acute Load, and Stress. In short, you can spike one category (badly) without necessarily killing your next training day. But all categories aren’t created equal.
Training Status: This is looking at your acute load, HRV status, load focus, and VO2Max trends. This one is less about should you train, and more about how you’re training. Meaning, are you doing too much high intensity, or too much low intensity? That’s what’ll give you an unproductive status. In other words, how would a coach look at your training log, ignoring most other life/feeling type metrics.
HRV Status: This is measuring your HRV values constantly while you sleep, and then comparing it against your 3-week baseline, up to a 90-day rolling window baseline. A single night of drinking doesn’t tank this score, but three nights of partying won’t keep you in the green.
Acute Load: This is looking at your last 7 days of load, except the load now burns off dynamically. Meaning, a hard training day 7 days ago is far less impactful to the score than a hard training day yesterday. Previously this was called 7-Day Load, now it’s Acute Load.
Load Focus: This shows which categories your training efforts have fallen into, over the last 4 weeks. These include Anaerobic, High Aerobic, and Low Aerobic. Basically, you need to have an even training diet to get faster. Simply running hard/all-out every day won’t make you faster. It’ll just get you injured and slower.
Recovery Time: This calculates how much time you need till your next hard-intensity workout. As is often misconstrued, this isn’t till your next workout, just your next hard one. This is largely the same as before. Exceptionally good sleep can speed this up, and inversely, a high-stress day can slow this down.
There are many metrics here, arguably, too many. But setting aside the quantity of them, most of them do actually have a purpose, even if confusing. If I were stepping back and looking at which ones to focus on, it’d essentially just be the new Training Readiness status. Before diving into that though, I’ve previously covered HRV Status components in my Forerunner 255 review here, so that’s a good place to dive into that component.
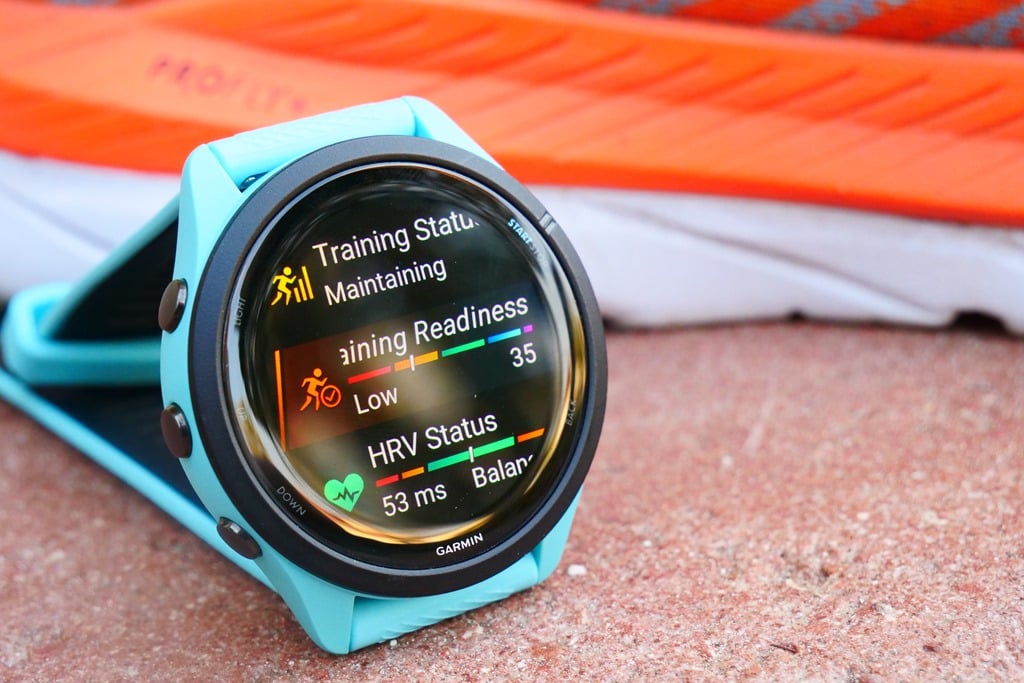
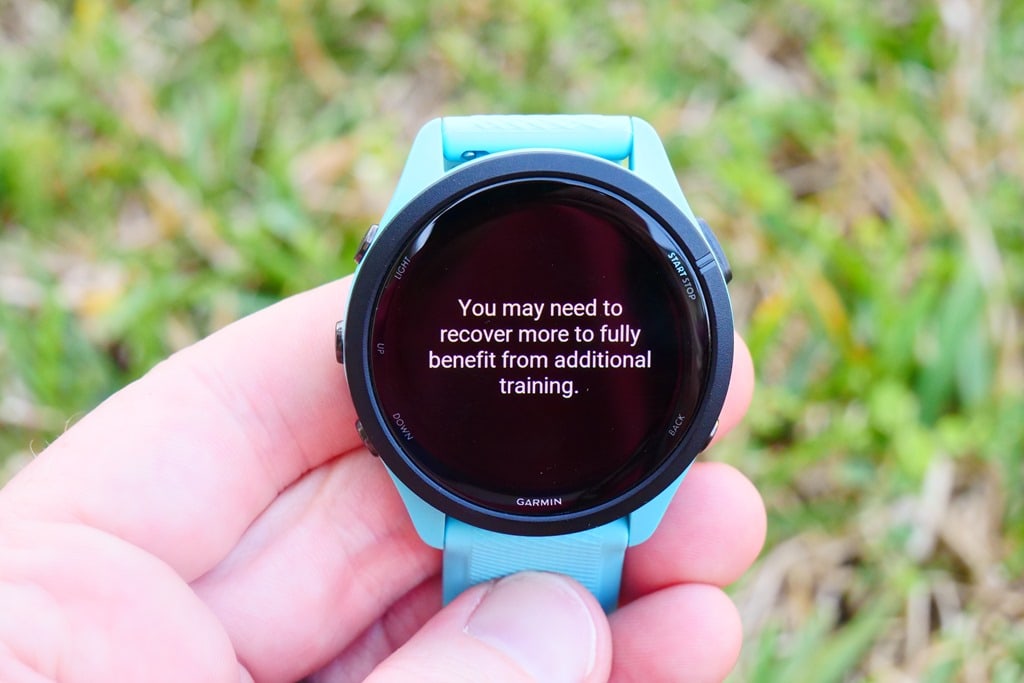
The idea with Training Readiness is to take a bunch of components under one umbrella, and figure out how ‘ready’ you are to ‘train’ at that very second in the day. The value will shift throughout the day (higher if you do nothing, lower if you do a workout). The score is comprised of all the fellows you’ve seen before: Sleep, Recovery Time, HRV Status, Acute Load, Sleep History, and Stress History:
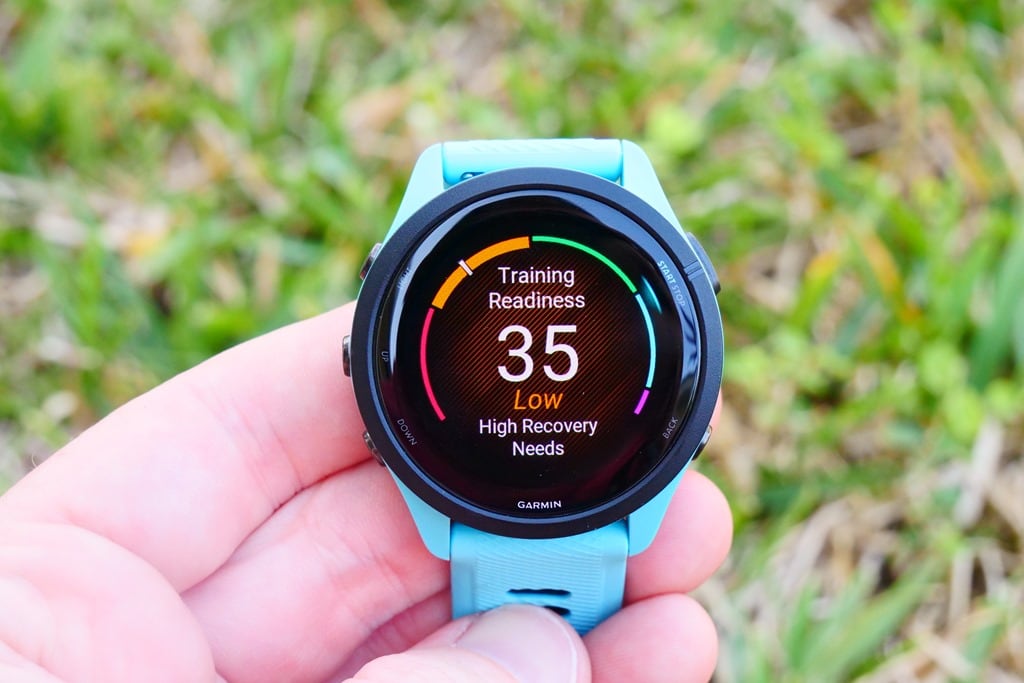
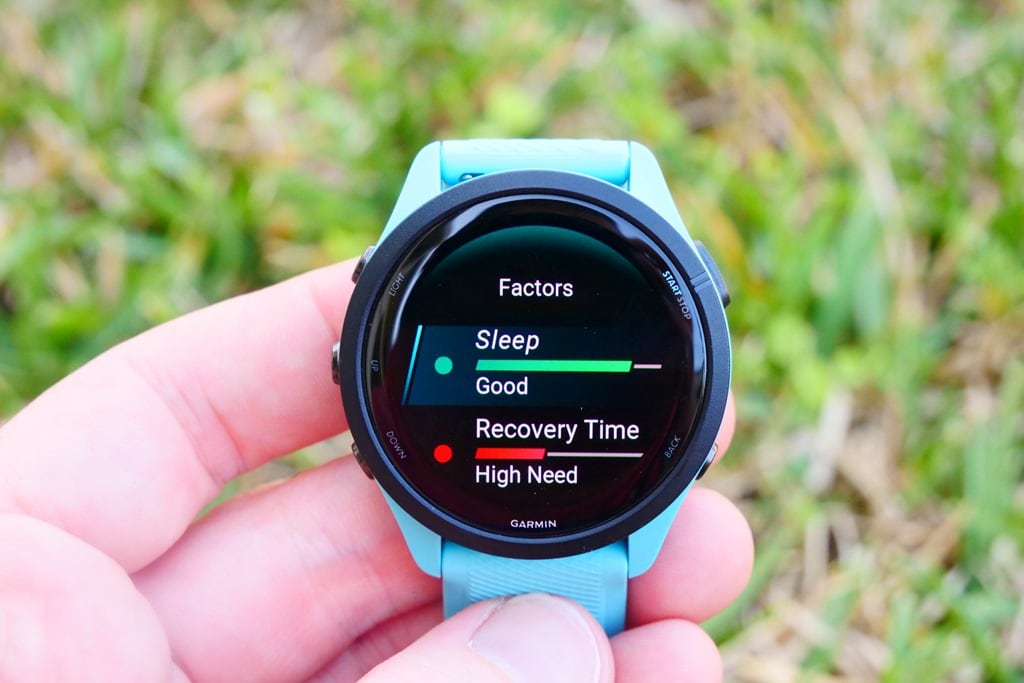
Each of the components are weighted in varying ways, and against varying timeframes. Here’s the run-down:
– Sleep: This one is specifically looking at last night’s sleep
– Recovery time: This looks at your Recovery time in hours (based on workouts, but can be sped-up with good recovery)
– HRV Status: This is comparing your 7-day trend versus historical trend
– Acute Load: This is looking at your 7-day trend, weighted towards newness
– Sleep History: This is looking at last night versus your prior 2 nights of sleep history
– Stress History: This is looking at the recent daytime data (excluding overnight readings)
Again, the premise here is that you can figure out what’s impacting your training readiness, and whether it’s expected. If you’re at a training camp, you’ll expect high Acute Load and likely high recovery time too. But hopefully, the other stats are normal/good. Thus, you can try and figure out whether to proceed or not. Whereas if everything is looking like a red dumpster fire, then you should probably train on the couch.
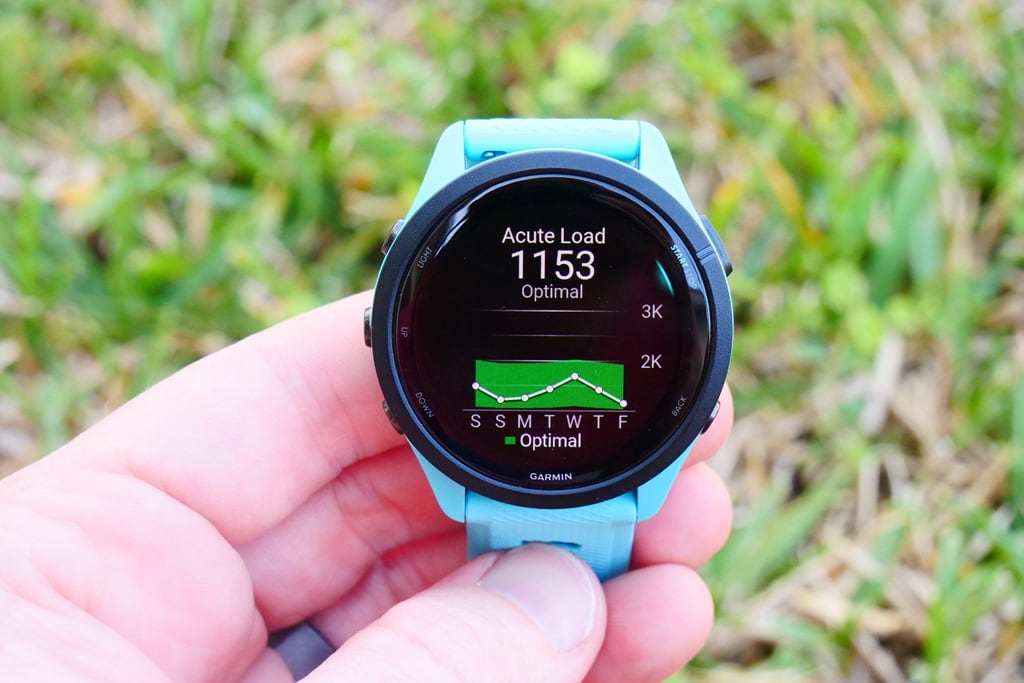
Now outside of sleep, the one I tend to look at the most is Acute Load. At first glance, you might think this is just 7-day Load renamed, but that doesn’t really cover what it actually does. Yes, it shows your 7-day load, but load burns off dynamically. In years past, if you had a big ride 6 days ago, that load would be factored into your total 7-day load duration as if it just happened yesterday. Versus with Acute Load, it’s weighted to burn-off within a few days, as logical. That’s because a week later it’s unlikely that big ride is still impacting you. The point of this is to reduce the massive swings that used to occur in the Training Status panel when a big workout from a week ago disappears, making you go instantly from Productive to Unproductive in a matter of seconds.
Here’s my acute load, and you can see how last week was an easy week, and this week is already higher as my workouts are longer/tougher. The green portion is my ‘tunnel’, which is basically my safe training load zone (high and low). Garmin’s UI rendering is a bit hard to see here, because my tunnel is so wide.
In addition to that, there’s the 4-Week Load Focus page, which categorizes the training type. This is notable because while the also-new Forerunner 965 adds a Training Load Ratio and Chronic Load page, the Forerunner 265 doesn’t get that. Though frankly, if you just follow the green tunnel in Acute Load, you kinda get the same thing anyway.
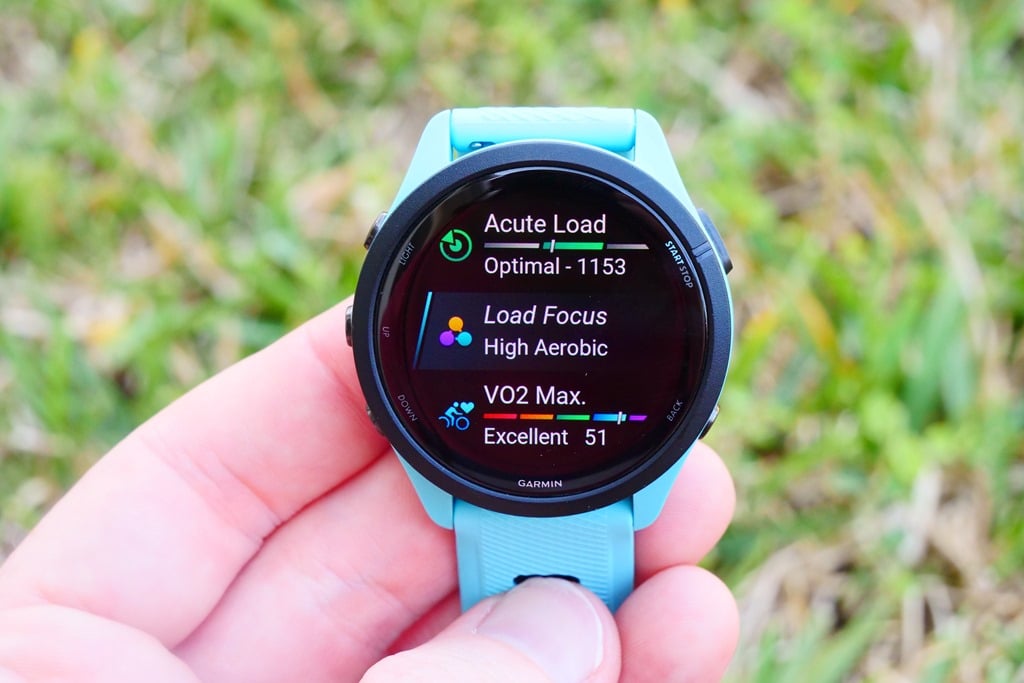
Now, all of this rolls back up into the Training Status page. This page aims to show whether or not the type of training I’m doing is beneficial to me getting faster. It’ll have messages like Productive, Unproductive, Maintaining, etc… Right now, I’m ‘Maintaining’, because apparently my VO2Max value is ‘Steady’ (meaning, neither going up nor down). So even though my HRV Status is good, my Load Focus is good, and all the other things are fine, since it thinks my VO2Max value isn’t going somewhere, I’m not ‘Productive’.
And this is where things can fall apart a bit. In my case, I’m definitely getting faster over the last two months. Both FTP tests and Garmin’s own race predictor show that quite easily. My training load the past two months has been substantial, yet measured. But my VO2Max values have been ‘stuck’ according to Garmin Connect since November (4 months ago). I’m not the only one. And as such, the Training Status is kinda broken. That’s largely why I’ve ignored it and instead focus on Acute Load and Training Readiness, which are more tangible. And all of this sets aside the fact that the actual VO2max values it has for me right now are rather low, compared to my running paces and FTP values (or just low compared to what it previously had till November, which was on low training fall training volume).
One last area to mention is Recovery Time. This largely hasn’t changed from before, but I need to briefly highlight it, because it’s now far more important in the Training Readiness score. Recovery time is showing your recovery time based on workouts. This is basically showing your recovery time till your next hard workout, in hours. This can speed up with a good night’s sleep, or slow down with crappy sleep or a very stressful day:
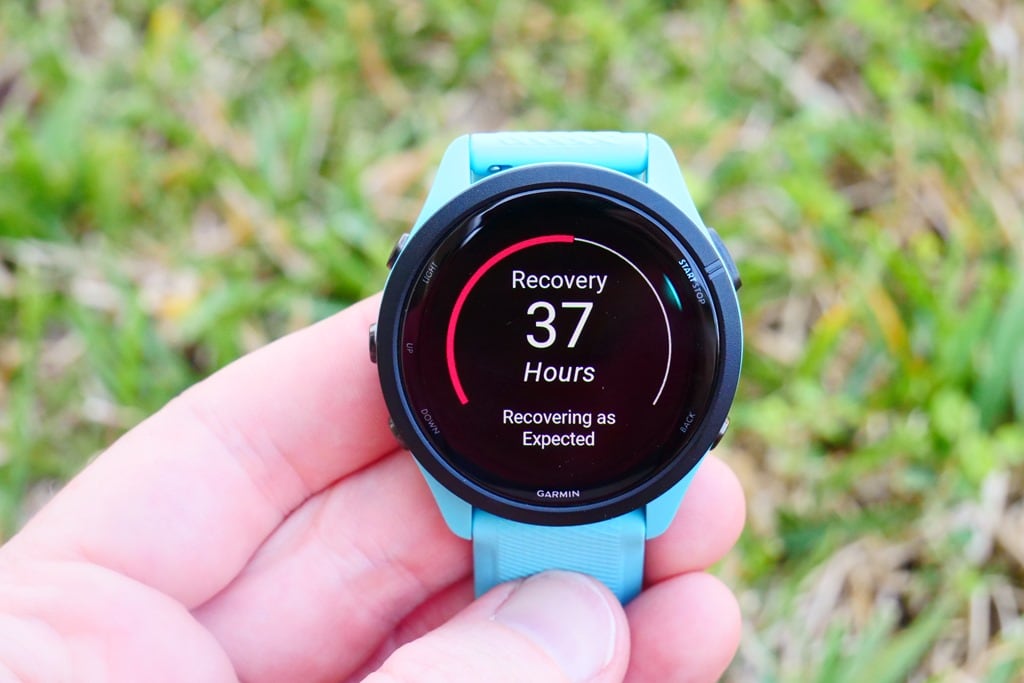
Now, all that said, setting aside from my current VO2Max bugs, Training Readiness and Acute Load is fairly valuable for me day to day. I look at Training Readiness each morning as a rough gut check of where I am in terms of recovery and preparation for the next big workout. However, I’m also not using it as the singular source to decide whether or not to train. It’s just one data input – I then use my own 15+ years of training/racing knowledge to layer atop that.
But I do find that it’s often good at reminding me when my body really is shot, or inversely, when I’m truly recovered (mostly after taking a few days off). The only downside? Somehow on the Forerunner 265, neither Training Readiness, nor Acute Load, nor Training Load Ratio, nor any other Training Status metric is available as a watch-face data component. It’s previously been on the Forerunner 955 and other watches, but not here. Hopefully they change that.
GPS Accuracy:
There’s likely no topic that stirs as much discussion and passion as GPS or heart rate accuracy. A watch could fall apart and give you dire electrical shocks while doing so, but if it shows you on the wrong side of the road? Oh hell no, bring on the fury of the internet!
GPS accuracy can be looked at in a number of different ways, but I prefer to look at it using a number of devices in real-world scenarios across a vast number of activities. I use 2-6 other devices at once, trying to get a clear picture of how a given set of devices handles conditions on a certain day. Conditions include everything from tree/building cover to weather.
Over the years, I’ve continued to tweak my GPS testing methodology. For example, I don’t place two units next to each other on my wrists, as that can impact signal. Instead, I’ll often carry other units by the straps, or attach them to the shoulder straps of my hydration pack or backpack. Plus, wearing multiple watches on the same wrist is well known to impact optical HR accuracy.
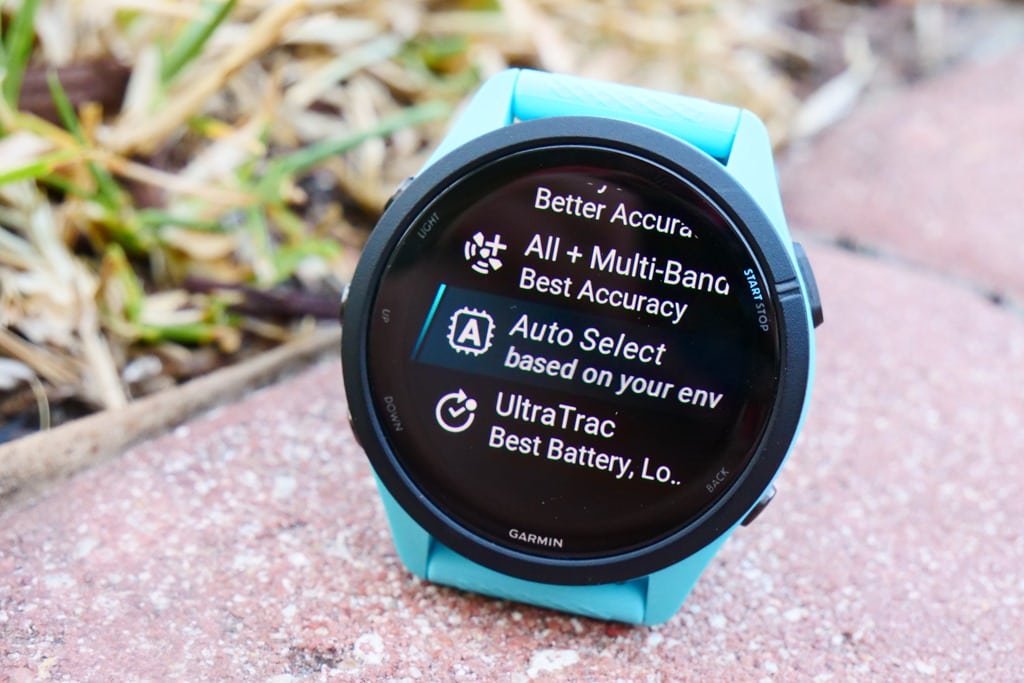
Normally, I’d spend a lot of time showing you chart after chart of perfectly good runs/rides/hikes. But this time, I’m going to save you (and me) a boatload of time. Because frankly, they’re all perfect. Nonetheless, if you want to look at data sets, you can. In the case of the Forerunner 965, I used Garmin’s newish SatIQ feature. That means that it will use multiband/dual-frequency GNSS when it needs to, but then save power with less power-draining GPS when it doesn’t. In all my testing since last summer of that feature, it’s basically spot-on in scaling up/down. There’s simply no need to force multiband GPS on Garmin devices. I’ve done mountain treks and deep city testing, and it nails both exactly in terms of scaling up/down.
Again, everything here is using SatIQ (which confusingly shows as ‘AutoSelect’ in the Garmin GPS menus), and as such, it’ll use multiband when it needs to, and save battery when it doesn’t. I’ve got a lot of sets, from a lot of workouts – but to save you a bunch of time (and me), there are no issues here. Just like with the FR255, it’s all spot-on. Still, I’ll quickly show a few sets and link to more if you want to dive into it.
First, we’ve got a tempo run I did, starting off in forest/jungle for the first couple kilometers, before getting to more suburban settings. Here’s the jungle:
And then, you can see the high-level GPS track:
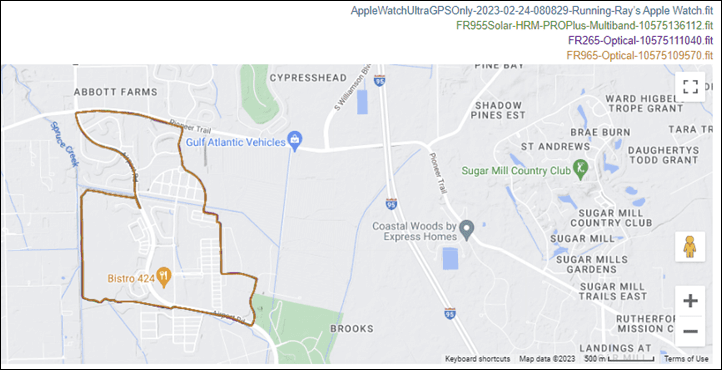
Then, in the jungle, the units are only a couple meters apart, but all very very close – really nothing to complain about here:
As I transition to suburbia, you can see they largely even stick within the bounds of the sidewalk:
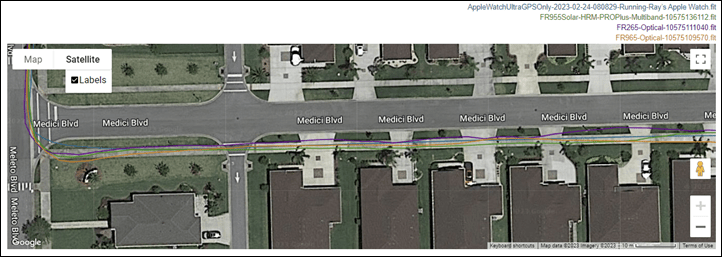
Again, I don’t have any complaints here. Nor on this other data set on relatively similar/nearby roads/trails – all exactly where I’d expect.
Next, here’s a ride I did. Practically speaking, this is a boring GPS track – since it’s out and back and out and back and out and back on a slim road along the coast for a few hours. In theory, this should be easy. But hey – plenty of GPS units have screwed up easier things. The idea here though is to see just how perfect these 6 sweeps were (road cycling):
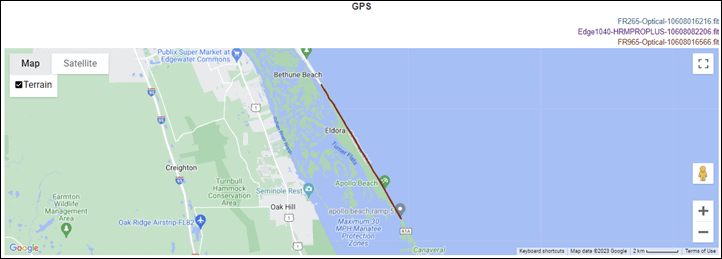
And if we look in on some random tidbits on the road – the answer is clear: Really darn perfect. It literally keeps all the tracks on the correct side of the small beach road in both directions:
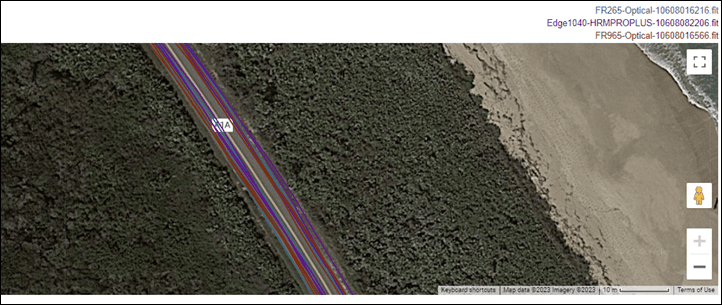
Even the tiny little turnaround at the end is perfect. Again, look at the size of the cars/parking spots for context on how small a space this is:
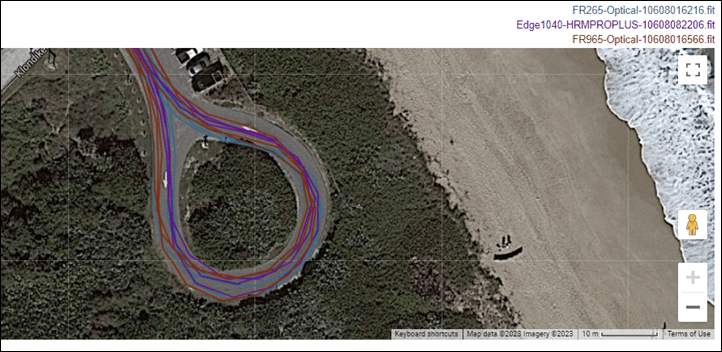
These results were also mirrored on another ride I did a week ago in the same location. Oh, and for fun, check out the battery graph here – showing about 20 hours of estimated battery life (this includes LiveTracking enabled, as well as power meter sensors). This 20 hours is on-spec. Also, note when I turned up the brightness on the Edge 1040 to full blast, it blows through the battery. I was taking pictures for a different review and wanted them easier to see on the camera:
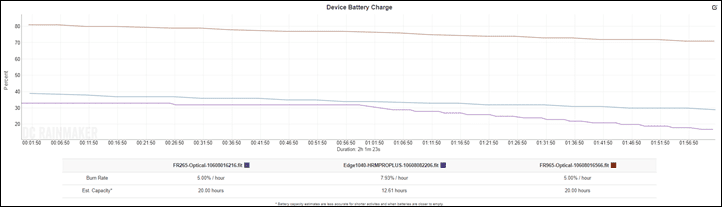
Finally, I set out for an openwater swim after my ride and run yesterday. In theory this would be about a 1,500m to 2,000m swim. In practice, it ended after a mere 90 meters:
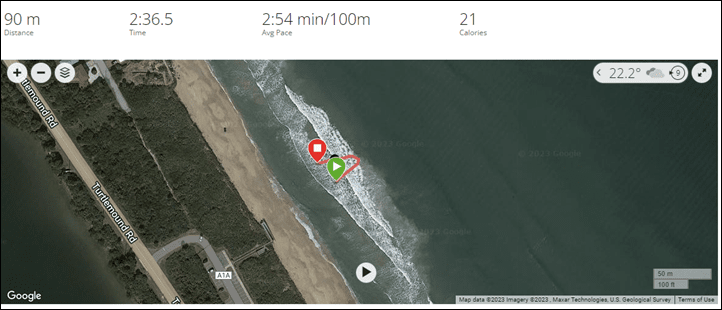
This was on account of a tiger shark being spotted less than 100 meters from me by some nearby beachgoers, who caught my attention to come ashore. I decided to postpone that swim. I’ll re-attempt this in a few days elsewhere without wildlife that wants to kill me, and update here accordingly.
I’ll also add some more city sets when I get a chance here in the coming weeks.
(Note: All of the charts in these accuracy portions were created using the DCR Analyzer tool. It allows you to compare power meters/trainers, heart rate, cadence, speed/pace, running power, GPS tracks and plenty more. You can use it as well for your own gadget comparisons, more details here.)
Heart Rate Accuracy:
Before we move on to the test results, note that optical HR sensor accuracy is rather varied from individual to individual. Aspects such as skin color, hair density, and position can impact accuracy. Position and how the band is worn, are *the most important* pieces. A unit with an optical HR sensor should be snug. It doesn’t need to leave marks, but you shouldn’t be able to slide a finger under the band (at least during workouts). You can wear it a tiny bit looser the rest of the day.
One of the things that’ll help with the Forerunner 265 compared to something like an Epix series watch is that the Forerunner 265 is lighter. In general, heavier watches will bounce around more, and thus are more challenging to get optical HR accuracy. That said, in my Fenix 7/Epix testing, I saw pretty much equal results across the different sizes.
Meanwhile, for HR accuracy testing I’m typically wearing a chest strap (either the Polar H10 or the Garmin HRM-PRO Plus), as well as another optical HR sensor watch on the bicep (often the Whoop 4.0 band). Note that the numbers you see in the upper right corner of the charts below are *not* the averages, but rather just the exact point my mouse is sitting over. Note all this data is analyzed using the DCR Analyzer, details here.
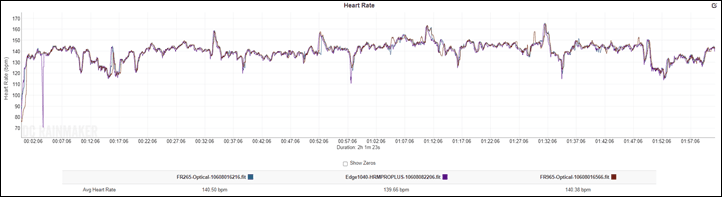
We’ll start off with something relatively basic to get warmed up, in this case a 14KM relatively steady-state run (you can click on any of these data sets to dig in deeper if you want). Both the FR265 and FR965 are exactly the same as the chest strap:
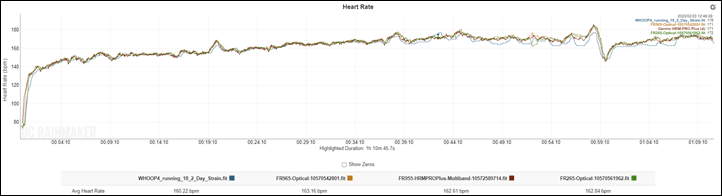
The only sensor that wobbled a little bit was the Whoop 4.0 strap towards the end as I went into one of the intervals (I did short sprint intervals every few kilometers).
Next, we’ve got a tempo run. In this case I built-up speed before reducing it on the cool-down. As you can see, the heart rate plot is flawless here from both the Forerunner 265 & Forerunner 965:
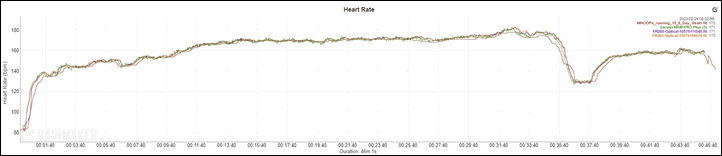
Now, we’ve got one run that shows some solid optical HR failures (out of many runs that are perfectly fine). In this case, I was doing 6x400m long intervals at a pretty high intensity (on pavement), followed by 4x200m intervals at a balls-to-wall speed. And you can see that the FR965 shows some latency on some of the 400m intervals, but then really struggled on some of the 200m intervals. Whereas the FR265 showed only very minor latency on a few intervals, but otherwise came out unscathed. My guess here is if I were to repeat this workout on a different day and flip which watch was on which wrist, I might see opposite results.
Remember that with optical HR sensors, when it fails it’s typically locking onto your run cadence, and thus in this case my run cadence would be rather hard/high, and the difference between my left leg and right leg might just be enough to trip it up. Other slightly less painful intervals I did didn’t show any differences. But I’ll try some more of these in the coming days…just for you.
Then there’s this VO2Max trainer interval ride. As you can see, it’s also boringly perfect for both the FR265 and FR965:
Next, we’ve got a road cycling ride. This is surprisingly good. I guess in some ways I gotta stop being surprised by Garmin’s optical HR sensor in road cycling. It’s been pretty good in most cases for the last year, and this is no exception. I also threw in some hard sprints every 20 minutes for fun (on an otherwise mostly steady-state ride):
There’s a handful of tiny bobbles for a few seconds here and there, but frankly, this is really good for both the FR265 and FR965. You also see a couple seconds of latency on the sprint, but again, most of their competitors would fail to put up anything like this for wrist-based optical HR.
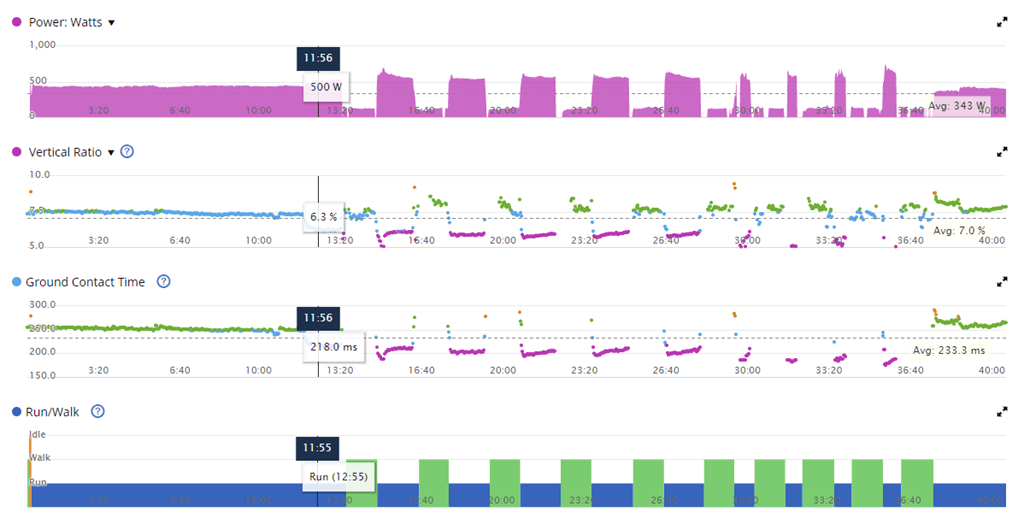
Oh, finally, for lack of anywhere else to stick it, here’s a quick comparison between the wrist-based Running Dynamics, and the HRM-PRO Plus chest strap running dynamics on the same run. First, here’s GCT. You can see it’s pretty close – with the exception of walking. During those two sections it fell apart for wrist-based:
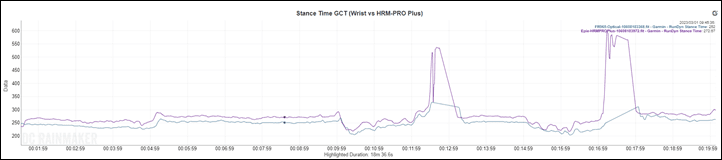
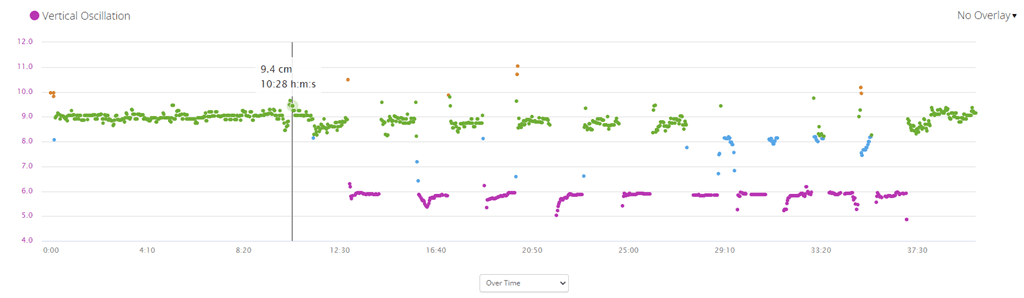
And the same is true for vertical oscillation. Not exactly the same, but in the ballpark:
And finally, vertical ratio – again, very similar on the walking being tricky:
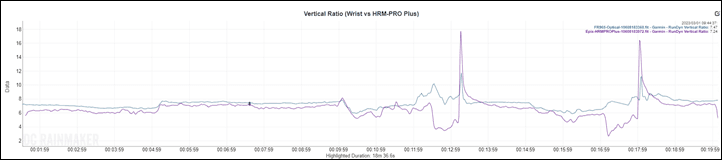
Again, I’m still not sure who exactly is actually using Running Dynamics – but if that’s you, you can likely use wrist-based without much difference in most scenarios.
As for the heart rate accuracy, we continue to see Garmin improve here, to the point where for most of my workouts where I’m not actually testing/comparing something, I’m using the optical HR sensor – even for most tough interval workouts. Exempting this specific 400m set above for the FR965, but hey, the FR265 did just fine. Though I tend to do more 800m or longer intervals usually, I was just feeling spicy this day. Again, generally it’s just good enough for my skin type/wrist that I’m seeing almost negligible differences between that and a chest strap. But obviously, it’s not always perfect (just like chest straps aren’t always perfect – especially in cooler weather).
Summary:
The Forerunner 265 is probably one of the best recent-memory examples of Garmin giving people exactly what they asked for, in the most literal way possible. When the Forerunner 255 came out last summer, a lot of people asked for an AMOLED version. And concurrently, they wished Training Readiness which had just launched on the Forerunner 955 was on the FR255. All the while, people with the AMOLED-laden Venu 2 series wished they had more sports features. Thus, welcome to the Forerunner 265: An AMOLED lightweight Garmin watch with Training Readiness.
Of course, Garmin’s gonna charge you for it, a $50 upsell from the existing Forerunner 255 Music (since the FR265 now includes music). But in a world where prices for everything are spiking, Garmin’s pricing has actually remained mostly reasonable.
What you don’t see here though are the non-sports Venu 2 Plus features showing up. No ECG, nor music-emitting speaker, nor microphone for voice calls, or even wireless charging like seen on the recent Vivomove Trend. And certainly not LTE like on the $149 kids Bounce activity tracker (which also has a brilliant display!). It’s clear Garmin is well underway in their transition towards AMOLED, but I remain skeptical that they understand how badly people just want a Venu 2 Plus hardware set with all the features of a Forerunner 265 or Forerunner 965 (with maps!). I’m sure eventually all these will arrive on a single unit, maybe with that nifty Fenix flashlight and emergency-only satellite connectivity. But I assume it’d arrive first on a Fenix, and then eventually down at this price point.
That all aside, I’m pretty happy with the Forerunner 265 as a daily workout watch. I could easily use it as my primary watch, if not for the occasional desire to have maps. Back a few years ago I used the Forerunner 745 as my daily driver, as I didn’t need maps much in a no-travel-pandemic world. But as travel has ramped up (including this week), I find myself back with the desire to have maps more. Exempting that though, it has literally everything I use day to day for swim/bike/run workouts.
In fact, my wife has been using the smaller Forerunner 265S daily now side by side (or opposite wrists) to her smaller Fenix 7S Solar Sapphire. I’ll give her another week or so, and then we’ll write-up something on her thoughts. She doesn’t generally use maps on her watch (she does on her bike computer). More on that soon.
With that – thanks for reading!
Found This Post Useful? Support The Site!
Hopefully you found this review useful. At the end of the day, I’m an athlete just like you looking for the most detail possible on a new purchase – so my review is written from the standpoint of how I used the device. The reviews generally take a lot of hours to put together, so it’s a fair bit of work (and labor of love). As you probably noticed by looking below, I also take time to answer all the questions posted in the comments – and there’s quite a bit of detail in there as well.
If you’re shopping for the Garmin Forerunner 265 or any other accessory items, please consider using the affiliate links below! As an Amazon Associate I earn from qualifying purchases. It doesn’t cost you anything extra, but your purchases help support this website a lot. Even more, if you use Backcountry.com or Competitive Cyclist with coupon code DCRAINMAKER, first time users save 15% on applicable products!
And of course – you can always sign-up to be a DCR Supporter! That gets you an ad-free DCR, access to the DCR Quarantine Corner video series packed with behind the scenes tidbits…and it also makes you awesome. And being awesome is what it’s all about!
Thanks for reading! And as always, feel free to post comments or questions in the comments section below, I’ll be happy to try and answer them as quickly as possible. And lastly, if you felt this review was useful – I always appreciate feedback in the comments below. Thanks!